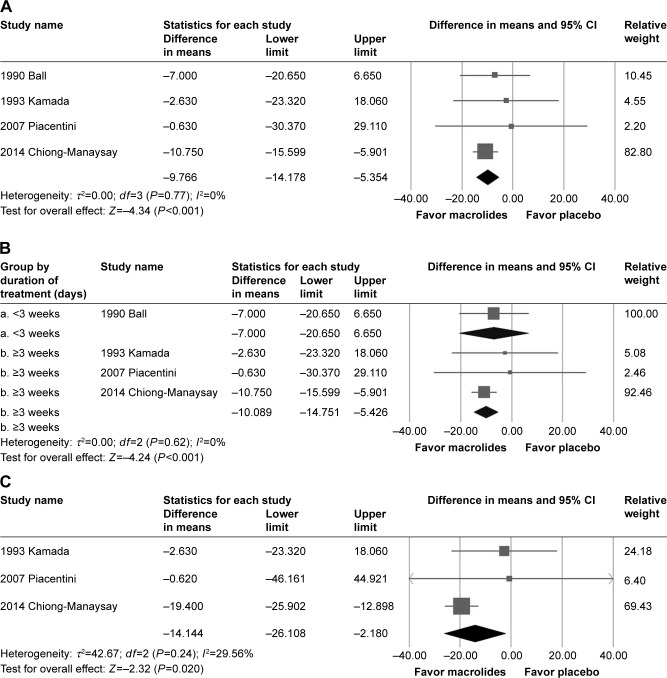
Figure 2.
(A) Forest plot of the decreased forced expiratory volume percentage (FEV1%) between the macrolides group and the placebo group. (B) Forest plot of subgroup analysis of FEV1% by the duration of macrolides. (C) Forest plot of the decreased forced expiratory flow (FEF) 25%–75% between the macrolides group and the placebo group.

