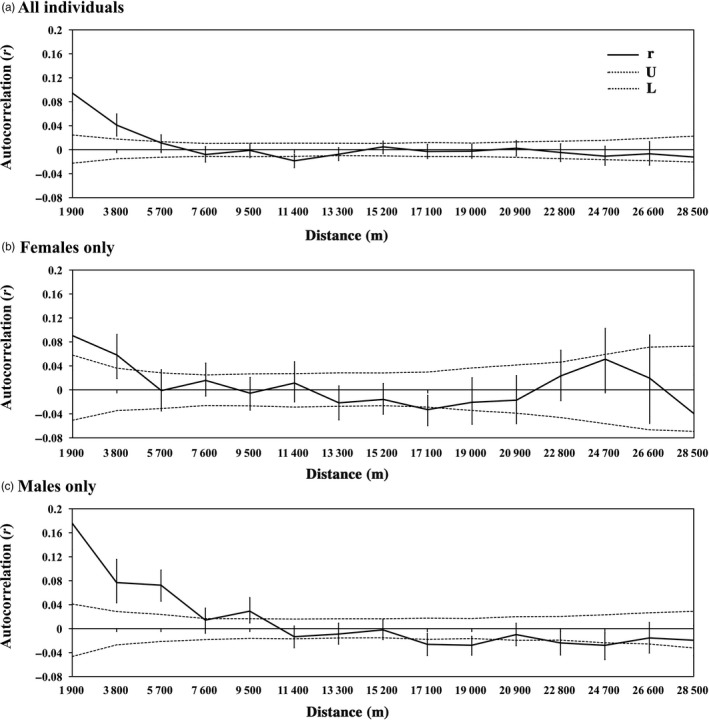
Figure 2.

Spatial autocorrelograms of all giant pandas, all females and all males. Spatial autocorrelograms of genetic correlation coefficient (r) as a function of geographical distance, with the permuted 95% confidence intervals (dashed lines) indicating random spatial genetic structure and the bootstrapped 95% confidence error bars around r. a) All giant panda individuals (n = 179); b) females only (n = 102); c) males only (n = 59)
