
Figure 4.
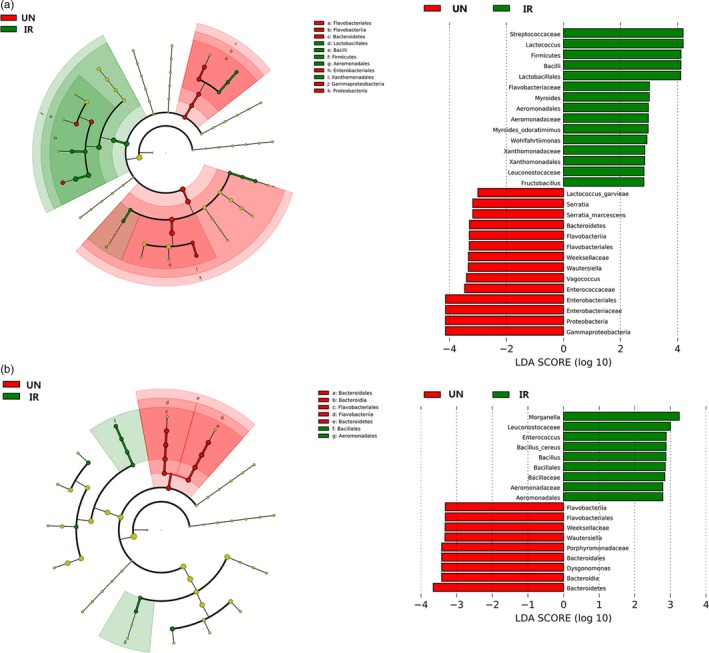
Irradiation induced changes in composition and structure of intestinal microbiota community. (a, b) Bacterial phylotypes of which abundances were changed in irradiated fly compared to un‐irradiated fly at 7 DPE (a) and 14 DPE (b) identified by LEfSe. The taxa listed in green most consistently describe irradiated samples. In contrast, those listed in red most consistently describe un‐irradiated samples. (a) At 7 DPE, cladogram (left) derived from LEfSe analysis of 16S rRNA gene sequences from irradiated samples and un‐irradiated samples. Green shaded areas indicate bacterial taxa that more consistently describe the irradiated samples; whereas red‐shaded areas indicate those that more consistently describe the un‐irradiated samples. Linear discriminant analysis (LDA) score (right) on the x‐axis represents log changes in relative bacterial phylotypes representation in un‐irradiated compared to irradiated flies at the upper right of the figure. (b) At 14 DPE, cladogram (left) derived from LEfSe analysis of 16S rRNA gene sequences from irradiated samples and un‐irradiated samples. Green‐shaded areas indicate bacterial taxa that more consistently describe the irradiated samples; whereas red‐shaded areas indicate those that more consistently describe the un‐irradiated samples. Linear discriminant analysis (LDA) score on the x‐axis represents log changes in relative bacterial phylotypes representation in un‐irradiated compared to irradiated flies at the bottom right of the figure. IR: irradiated sample; UN: un‐irradiated sample