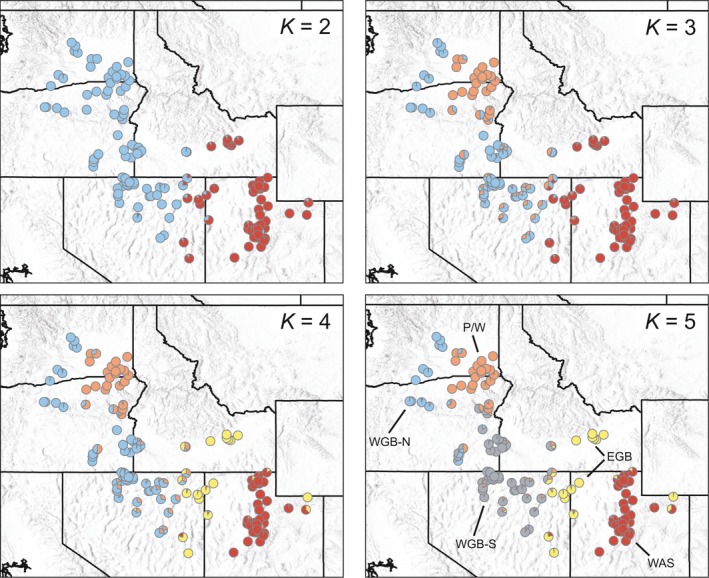
Figure 4.

Results of structure analyses for K = 2 to K = 5. The posterior probabilities of individual assignments are averaged within sampling localities and represented by pie charts. Populations discussed in the text are noted for K = 5 and include Palouse/Wallowa (P/W); Western Great Basin (WGB‐North and WGB‐South); Eastern Great Basin (EGB); and Wasatch (WAS)
