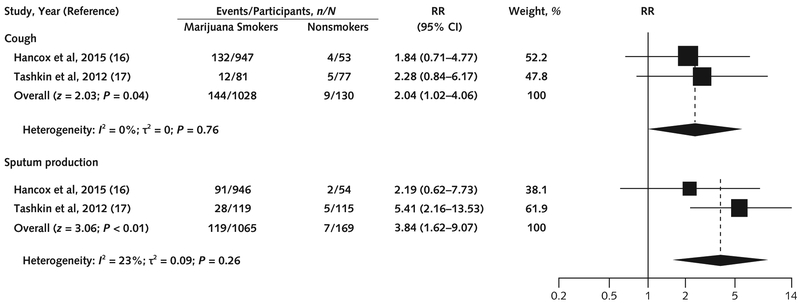
Figure 2. Association between marijuana use and cough and sputum production in prospective cohort studies.
We used the Paule–Mandel method for estimating τ2. The squares indicate RRs from primary studies, and size reflects the statistical weight of the studies. The horizontal lines indicate 95% CIs. The diamonds represent the subtotal and overall RR and 95% CI. The vertical solid line shows the line of no effect (RR = 1). The pooled RR was not significant after the Knapp–Hartung small-sample adjustment for cough (P = 0.10) and sputum production (P = 0.20). RR = risk ratio.

