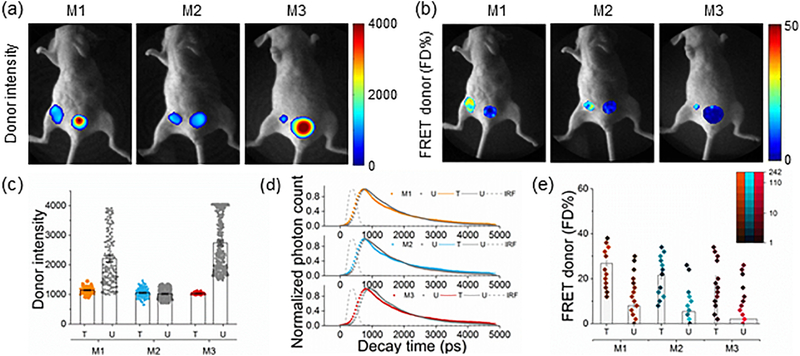
Figure 2|. Whole body quantification of ligand-receptor engagement.
(a-b) Tumor-carrying mice (M1-M3) were injected with 40 μg holo-Tf-AF700 (donor) and 80 μg holo-Tf-AF750 (acceptor) at A:D ratios of 2:1 and subjected to MFLI-FRET imaging at 24h p.i. Panels show Tf donor fluorescence intensity maximum (total Tf, including soluble and bound Tf) (a) and FD% levels (bound Tf) (b) of live, intact mice using the MFLI-FRET imager. Within each mouse image, left ROIs show tumor and right ROIs show bladder fluorescence (a) and FD% (b) levels. (c) Quantification graphs of donor intensity in tumor xenografts at 24h p.i. Data are presented as individual pixels with mean ± 95% confidence interval. (d) Donor fluorescence lifetime decay curves of tumors and bladders at 24h p.i. There is a reduction in the fluorescence lifetime in the tumors showing FRET signal compared to the bladders. Bi-exponential fitting is used to retrieve relative populations of donor in the FRETing state (FD%). IRF is the instrument response function. (e) Quantification graphs of FD% levels in tumor xenografts at 24h p.i. based on histogram distributions: pseudo-color range indicates pixel intensity frequency using log scale, and boxes represent mean value. The width of boxes indicates the total number of pixels. Error bars represent 95% confidence interval but are too small to display (Supplementary Table 1).

