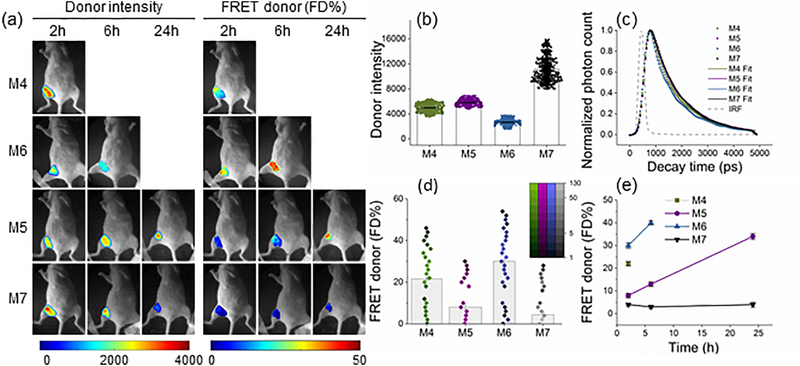
Figure 3|. Longitudinal quantitation of ligand-receptor engagement.
(a) Mice were injected with 40 μg TfAF700 and 80 μg Tf-AF750 at A:D ratios of 2:1 (M4–6) and 0:1 (M7) and subjected to in vivo wide-field MFLI-FRET imaging at various p.i. time periods. Panels show mice images including tumor ROI with Tf donor fluorescence intensity maximum (total Tf) and FD% levels (bound Tf) of mice using the MFLI-FRET imager as in Figure 2. (b) Quantification graph of donor maximum intensity in the tumor regions at 2h p.i., as for Fig. 2c. (c) Donor fluorescence lifetime decay curves of tumors at 2h p.i. Bi-exponential fitting is used to retrieve relative population of donor in FRETing state (FD%). IRF is the instrument response function. (d) Quantification graph of FD% signal in the tumors at 2h p.i., as in Fig. 2e. 95% confidence intervals are shown in Supplementary Table 2. (e) Longitudinal imaging of tumors M4-M7 over the course of 24 h MFLI-FRET imaging experiment. Error bars represent 95% confidence intervals.

