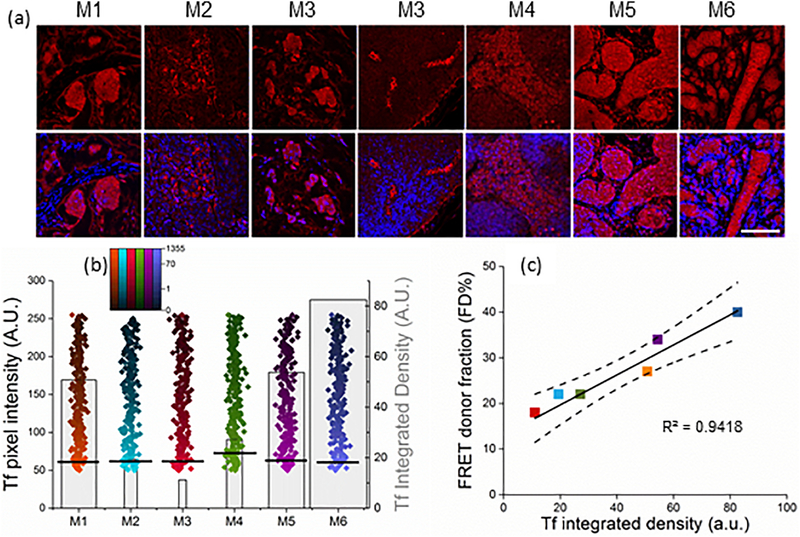
Figure 5|. Tf binding to tumor cells correlates with FD% signal.
(a) Confocal images of Tf immunofluorescent staining in tumor sections M1-M6. Polyclonal anti-Tf antibody was applied to the tissues and visualized with VectaFluor Excel antibody kit. Nuclei are stained with DAPI. Scale bar is 100μm. (b) Quantification of whole tissue scans of human Tf immunofluorescent staining was done using Neurolucida system and calculated as integrated density in ImageJ. Black lines represent mean values of pixel intensity, pseudo-color range indicates pixel intensity frequency using log scale, and gray boxes represent mean value of integrated density. The width of the boxes indicates the total number of pixels. Error bars represent 95% confidence interval but are too small to display (Supplementary Table 4). (c) Linear regression of the unweighted means of FD% as a function of Tf integrated density using data from both imaging experiments. Only FD% values from tumors imaged at the last time point post-injection before sacrifice were included (Supplementary Table 5). Regression line and the 95% confidence interval (dotted lines) for the line are plotted. FD% as a function of Tf integrated density levels (slope = 0.3 (SE=0.04) FD%/Tf; p=0.001; intercept=14.75 (SE=1.8); r2 = 0.94).

