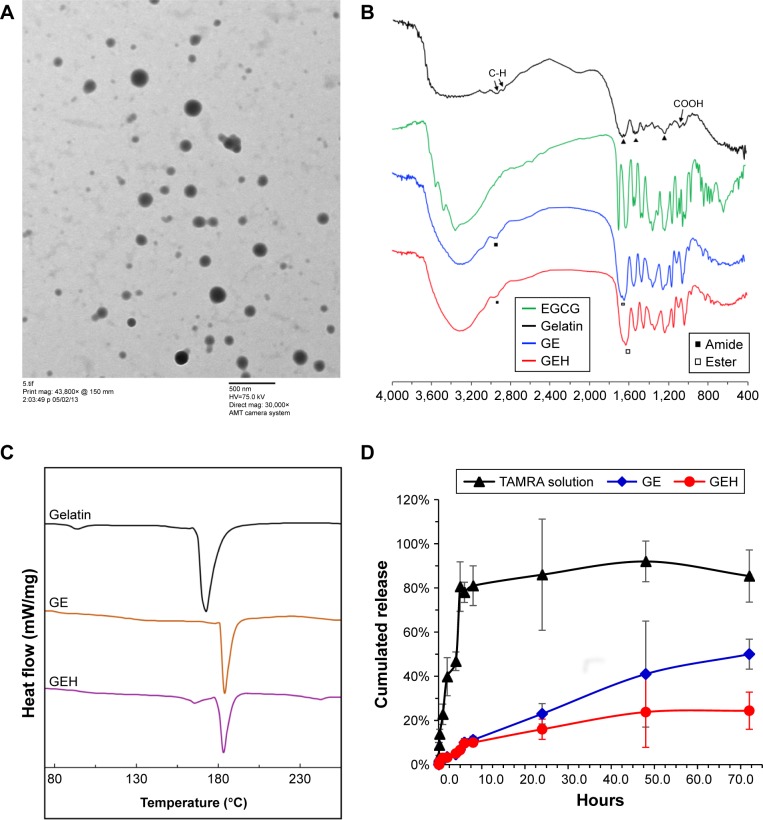
Figure 2.
Characterization of EGCG-loaded nanoparticles.
Notes: (A) TEM morphology of GEH using an HA concentration of 62.5 µg/mL. (B) FTIR spectra, (C) DSC thermography, and (D) release patterns of variant formulations.
Abbreviations: DSC, differential scanning calorimetry; EGCG, epigallocatechin gallate; FTIR, Fourier-transform infrared spectroscopy; GE, gelatin–EGCG; GEH, GE with HA coating; HA, hyaluronic acid; TAMRA, tetramethylrhodamine; TEM, transmission electron microscopy.

