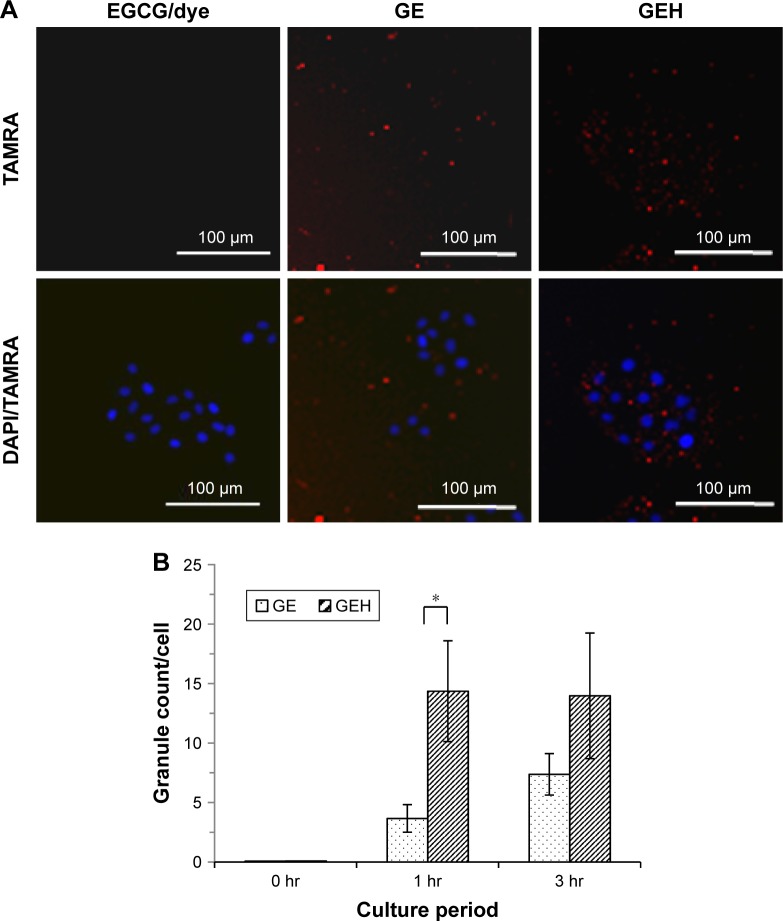
Figure 4.
Distribution of dye or dye-conjugated NPs in HCECs.
Notes: (A) TAMRA, GE, and GEH taken up by HCECs after 3 hours’ coculture. (B) Quantification of NPs in cells (TAMRA 100 µg/mL, EGCG 20 µg/mL; n=3). *Statistically significant when compared with GEH (P<0.05).
Abbreviations: EGCG, epigallocatechin gallate; GE, gelatin–EGCG; GEH, GE with hyaluronic acid coating; hr, hours; NPs, nanoparticles; TAMRA, tetramethylrhodamine.

