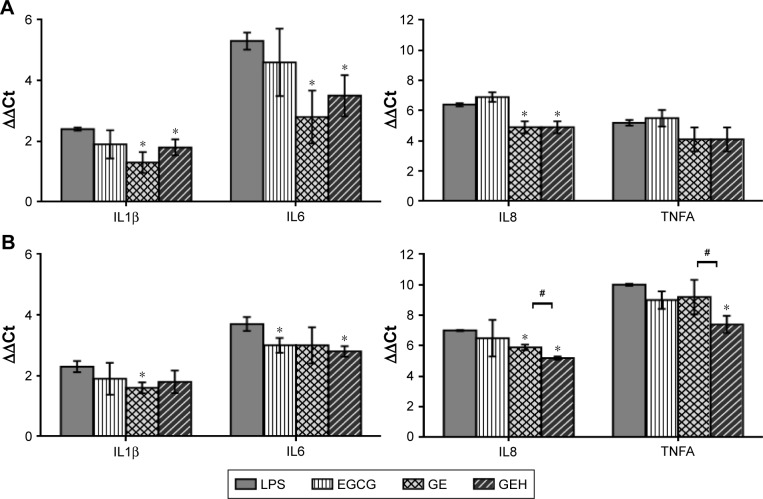
Figure 5.
Expression of IL1B, IL6, IL8, and TNFA in HCECs after (A) 24 and (B) 48 hours of treatment with various EGCG formulations.
Notes: HCECs were treated with LPS to induce inflammation. Cells not treated with LPS were used as controls. The results are expressed as fold increase compared with normal HCECs. All groups were compared with the LPS group for statistical analysis (n=3). *statistically significant when compared with control (P<0.05); #statistically significant when compared with GEH (P<0.05)
Abbreviations: EGCG, epigallocatechin gallate; GE, gelatin–EGCG; GEH, GE with hyaluronic acid coating; HCECs, human corneal epithelium cells; LPS, lipopolysaccharide.

