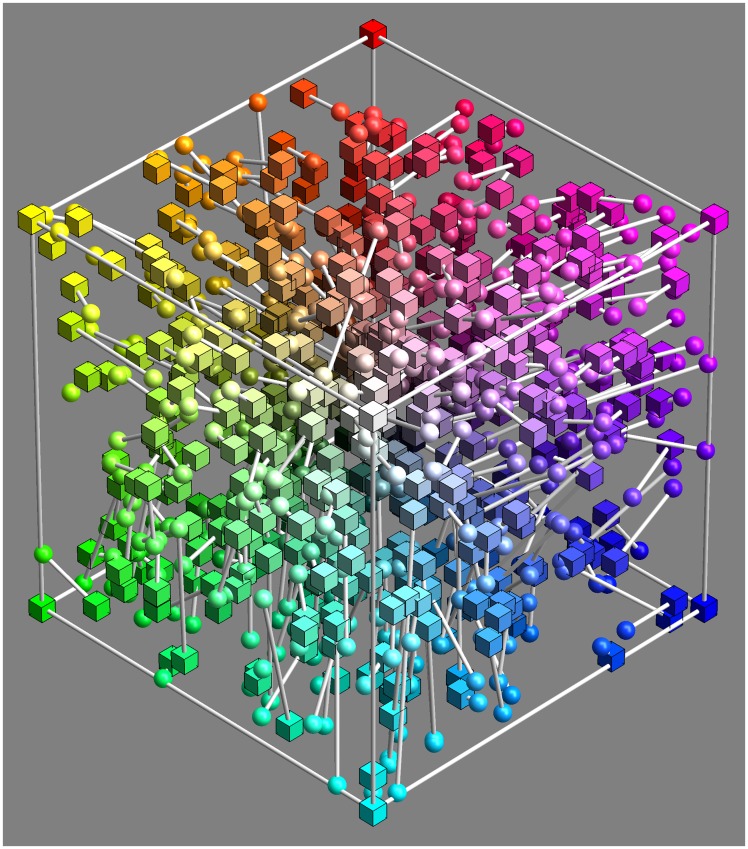
Figure 6.
Five hundred randomly selected, raw settings (i.e., less than 17% of the total data volume; the full data set is not shown because too confusing). The spherical marks show the participants approximation to the target indicated as cubical marks. This basic data set is converted to a smoothly interpolated field of covariance ellipsoids. All further analysis is performed on that statistical summary of the raw settings.

