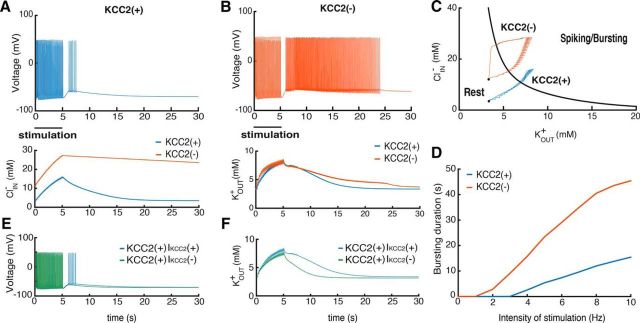
Figure 2.
Consequences of the KCC2(−) pathology in single PYs. A, B, voltage trajectories of the KCC2(−) and KCC2(+) PY neurons after stimulation with periodic AMPA, GABA, and NMDA synaptic input for 5 s. Bottom, Changes in K+ and Cl− levels. C, State diagram of the model and changes in ionic concentrations. Red and blue trajectories correspond to the KCC2(−) and KCC2(+) cells, respectively. D, Relations between stimulus intensity and firing after stimulation for KCC2(−) (red) and KCC2(+) (blue) cells. E, Voltage trajectories of the KCC2(+) with and without KCC2 contribution to the extracellular potassium after the same synaptic stimulation as in A [KCC2(+) IKCC2(+) and KCC2(+) IKCC2(−)]. F, The corresponding extracellular potassium concentration changes.

