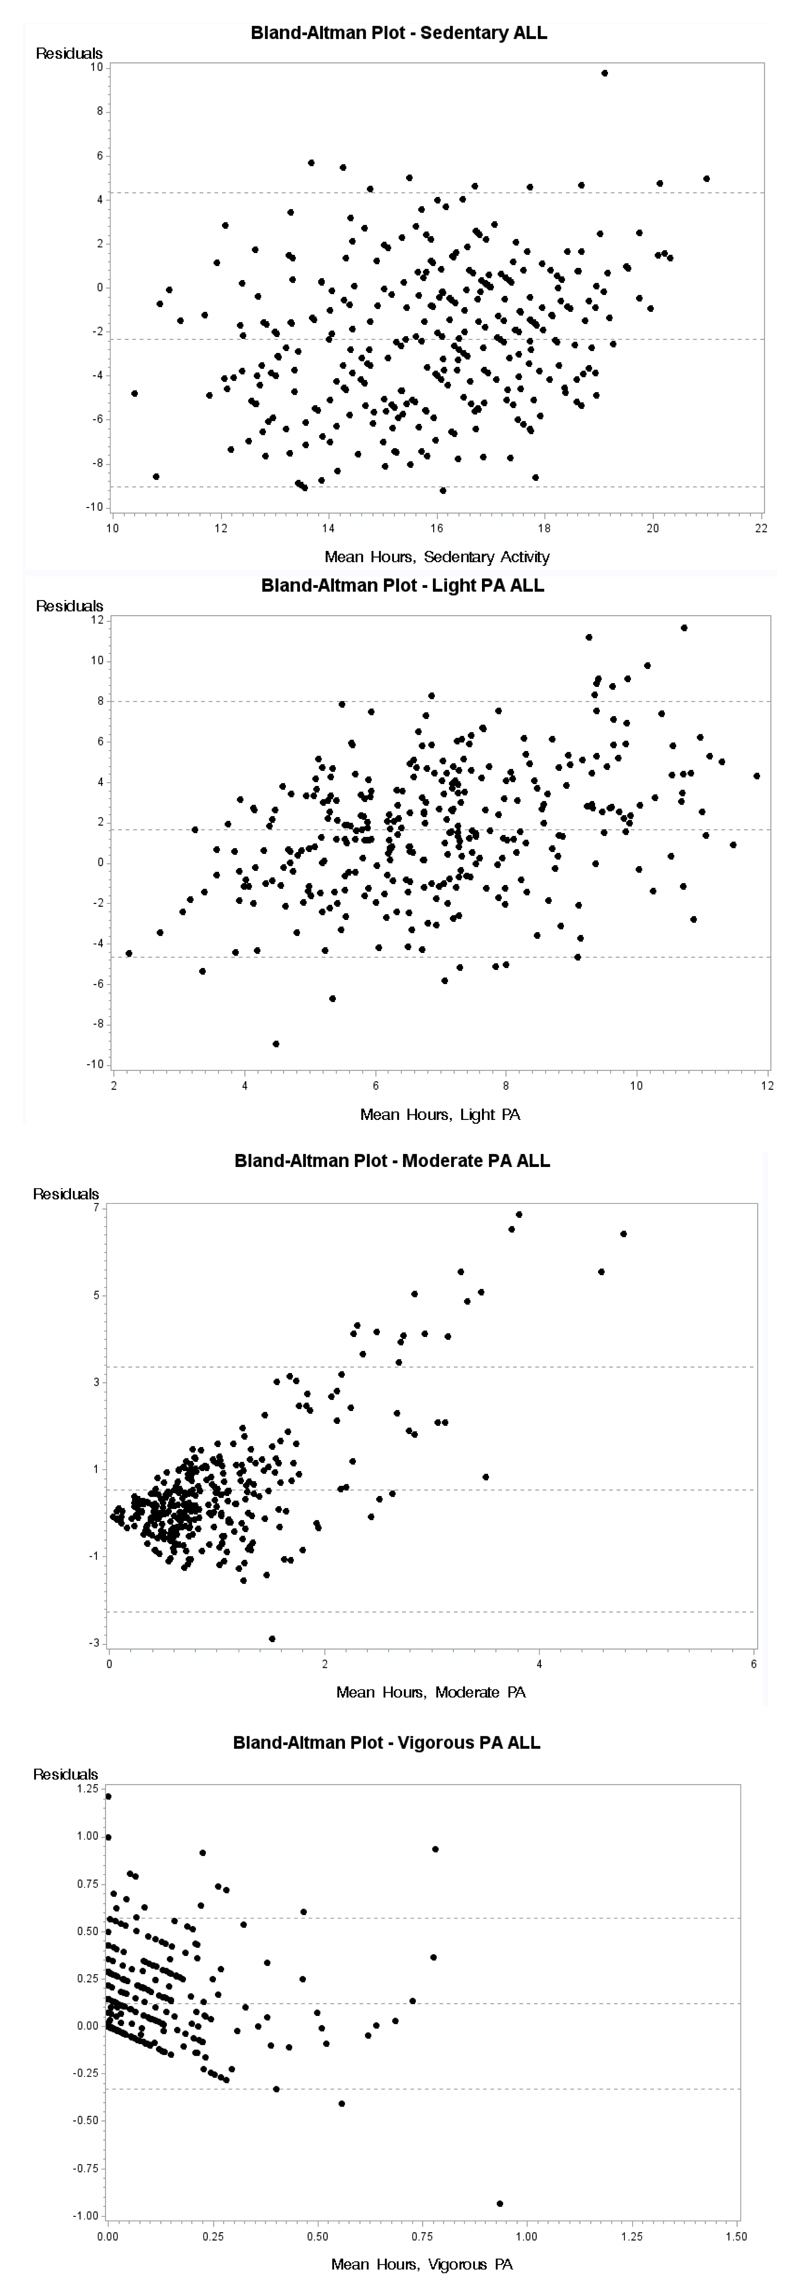
Figure 1. Bland-Altman plots of the agreement between self-reported PA (PAS2) and objectively measured PA (Acc+HR) for the total population (n = 330).
X-axis: mean hours of Acc+HR. Y-axis: absolute difference between PAS2 and Acc+HR. The line in the middle represent mean difference between the two measurement methods and the lower and upper line represent 95% limits of agreement.

