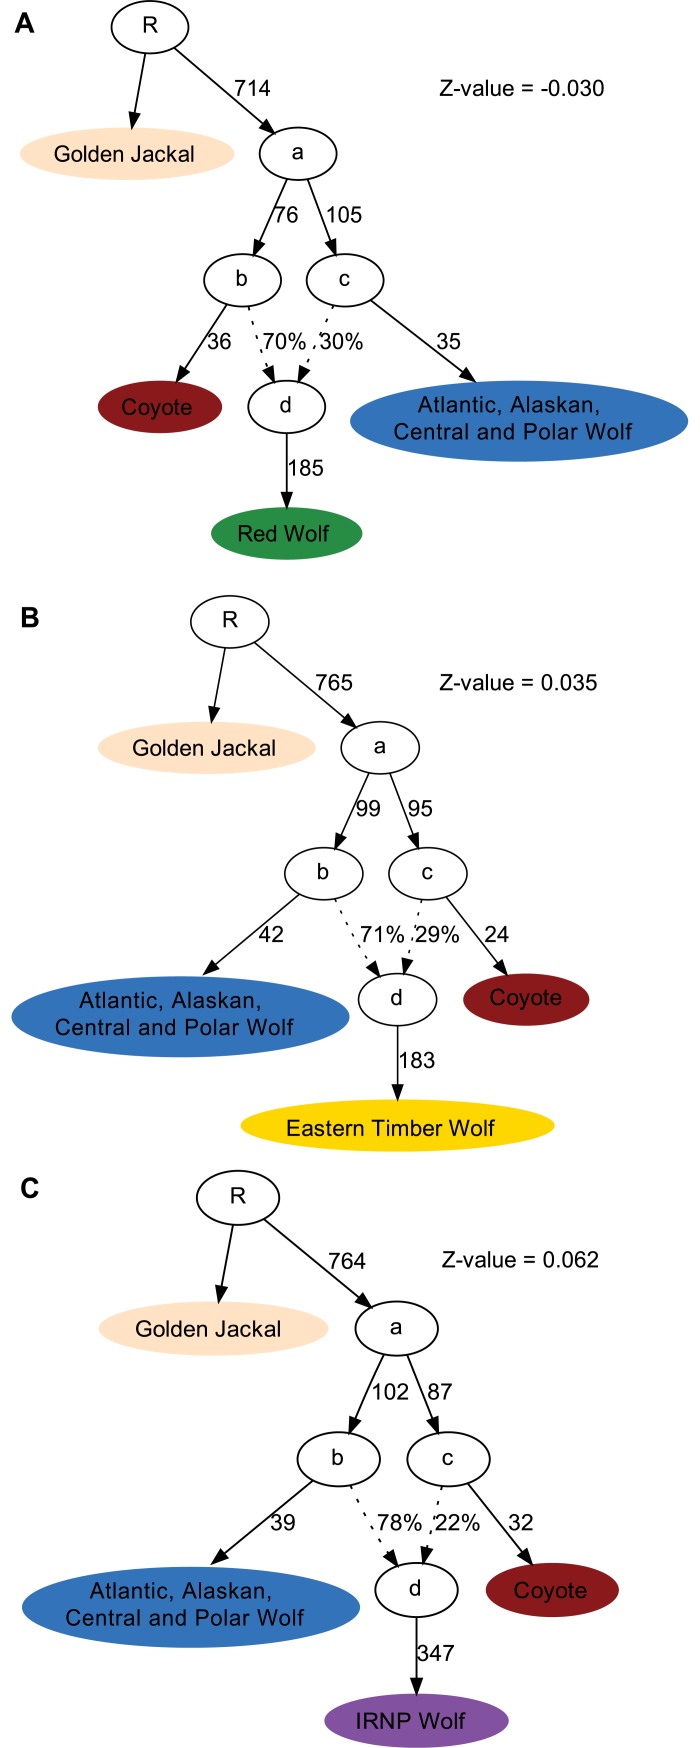
Fig 2. Admixture graph modelling the origin of American wolf like canids.
Models fitting the ancestral makeup of A) red wolves, B) Eastern timber wolves and C) Great lakes wolves. The specific samples used in each cluster are given in S1 Table. Internal nodes denoted by letters from a to d are hypothesised meta-populations. Tip nodes indicate the sampled genomes used to fit the graph. Dotted connecting lines represent admixture events, with the percentages indicating the admixture proportions. Solid connecting lines represent the divergence between populations with the numbers indicating their corresponding branch lengths.

