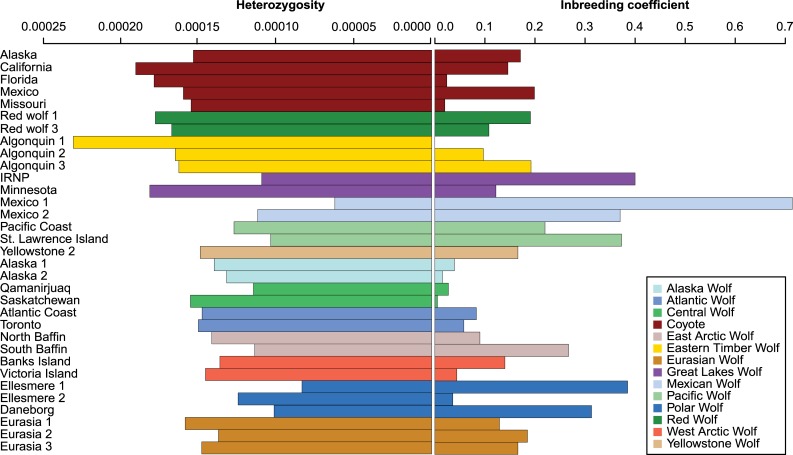
Fig 5. Bar charts of heterozygosity estimates and inbreeding coefficients.
To the left, estimates of heterozygosity estimated using ANGSD, obtained by bootstrapping the set of variant sites. The standard errors are of the order of 10–6 (not shown on plot). The colours represent the different population of North American wolf like canids.

