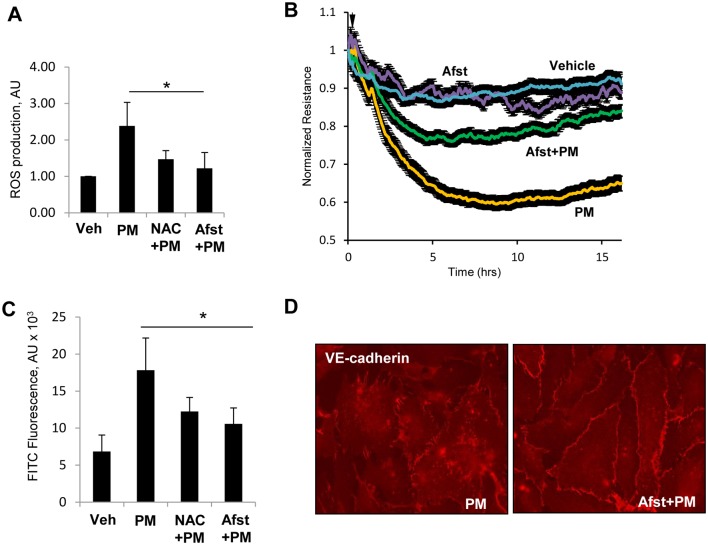
Fig 3. PM induces EC barrier disruption via ROS generation.
(A) Cells were treated with PM (20 μg/cm2, 30 min.) with or without pre-treatment with N-acetyl cysteine (NAC, 1 mM, 30 min) or amifostine (Afst, 4 mM, 30 min) and ROS levels were measured. Normalized data are expressed as mean ± S.D.; n = 6, *p<0.05. (B) TER was monitored across PM-treated EC monolayers in the presence or absence of Afst. (C) FITC fluorescence was determined by XPerT assay described in Methods. n = 6, *p<0.05. (D) VE-cadherin staining of cells treated with PM with or without pretreatment with Afst.

