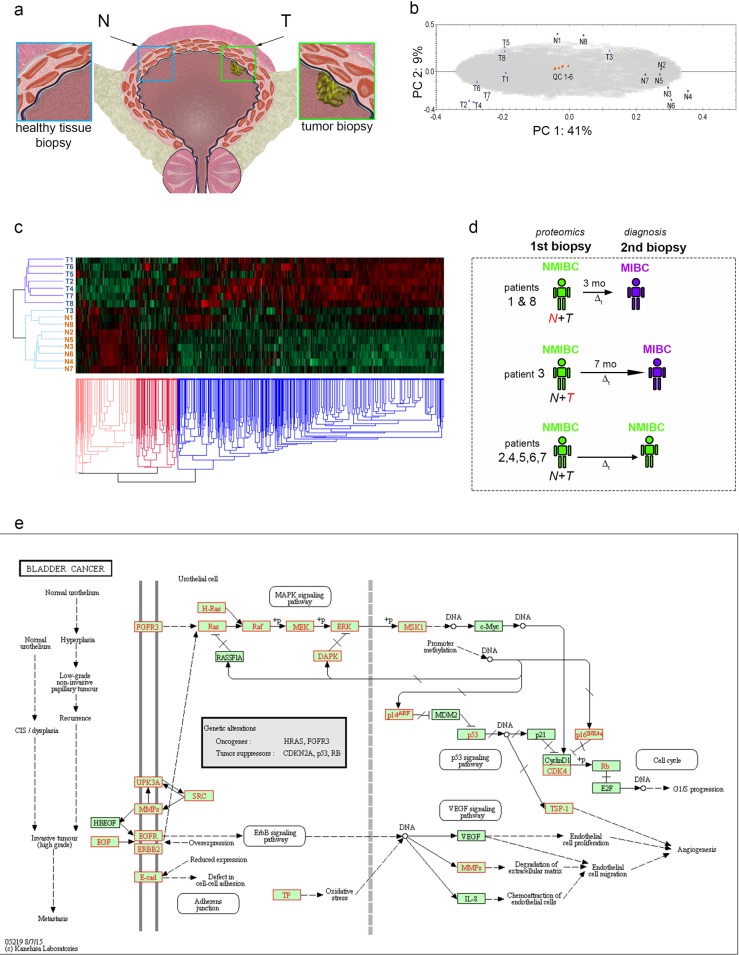
Fig 1. Global proteomics of eight NMIBC patients reveals outliers.
a) Cartoon depicting the bladder and the generic location of the biopsies prelevation for proteomics (T = tumor, N = normal). b) PC plot of tumor biopsies “T” and normal bladder “N” from eight patients and six quality control samples. c) Hierarchical clustering with heat map show a separation between tumor biopsies “T”, normal biopsies “N” and illustrate outliers T3, N1 and N8. d) Scheme depicting the time evolution of the outliers (red letters) and typical patients patients (green–NMIBC, purple–MIBC Δt—time interval). e) KEGG pathway of bladder cancer; red marks annotation of proteins identified to genes with known involvement in bladder cancer.

