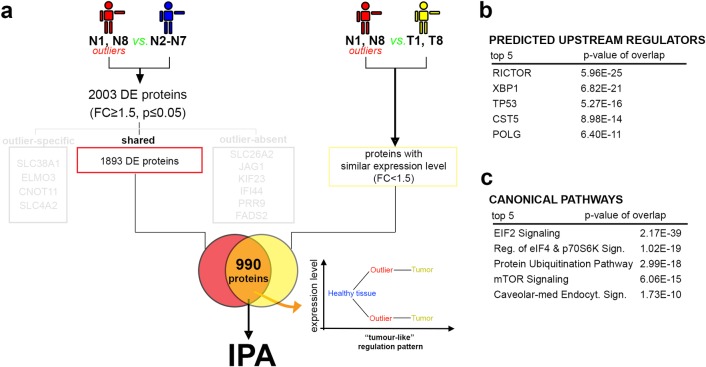
Fig 3. Global proteome analysis of similarities between the outlier and tumor samples.
a) Scheme depicting the experimental design of the proteome comparison strategy. b) Table of the predicted upstream regulators responsible for the deregulated proteomic fingerprint observed in the outlier samples. c) Table of the canonical pathways revealed by the pathway analysis in the analyzed DE protein list.

