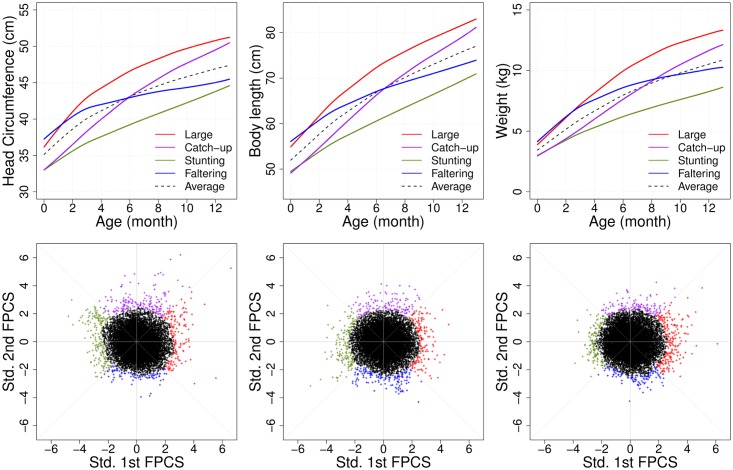
Fig 4. Extreme functional patterns from marginal analysis.
Head circumference (HC, left), body length (LN, middle) and weight (WT, right) traits, respectively. Four outlying clusters (falling into the smallest 5% of the bivariate density) are demonstrated with respective different colors, with estimated mean curves corresponding to the four outlying subgroups, respectively, which represent the four qualitative longitudinal growth patterns: “Generally Large” (red), “Catch-up” (purple), “Stunting” (green) and “Faltering” (blue) (top panels). The corresponding scatterplots for the first two functional principal component scores (bottom).

