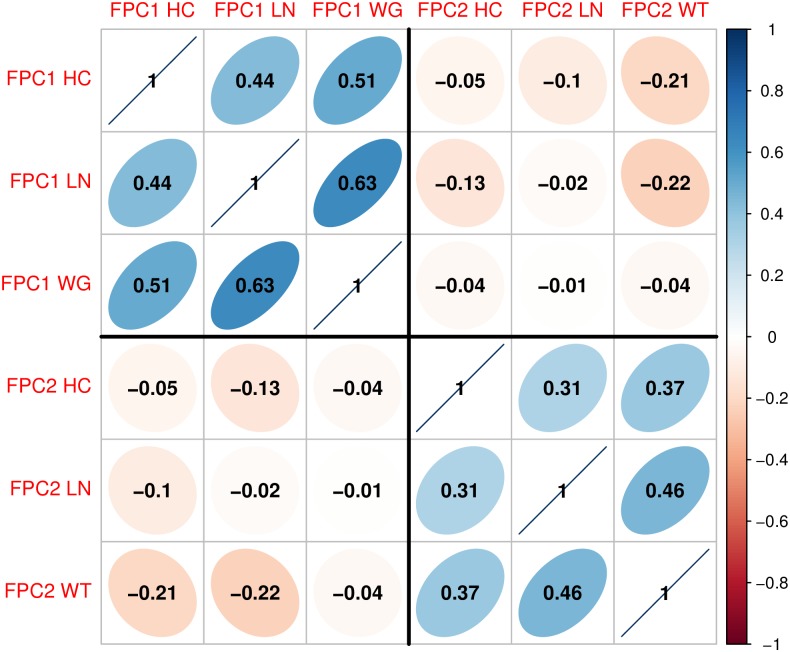
Fig 6. Correlation plot.
Correlations between the first two functional principal component (FPC) scores of head circumference (HC), body length (LN) and weight (WT). FPC scores among the first and second components have positive correlations, respectively, which suggests to combine the three growth features linearly with PC loadings as in Table 2.

