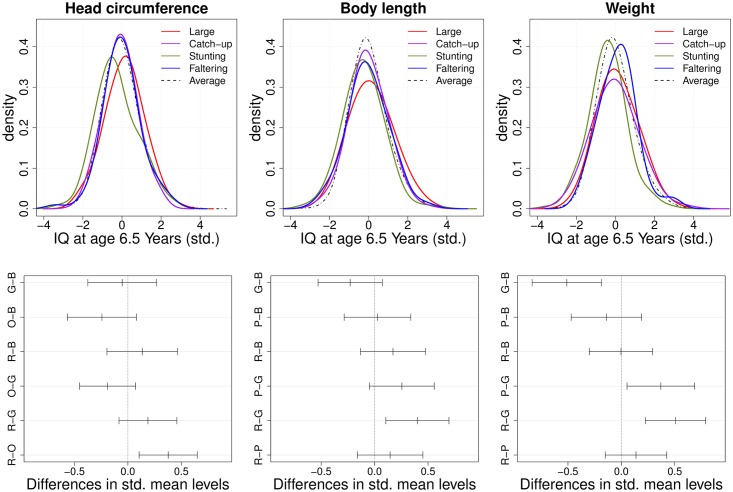
Fig 7. Marginal subgroup identification.
(Top panels) Conditional kernel density estimators and (bottom panels) illustrations of Tukey’s multiple comparisons for standardized IQ along outlying subgroups. As in Fig 5, the first two functional principal component (FPC) scores are used to construct subgroups for head circumference (left), body length (middle) and weight (right), labeled R (red, “Generally Large”), P (purple, “Catch-up”), G (green, “Stunting”) and B (blue, “Faltering”).

