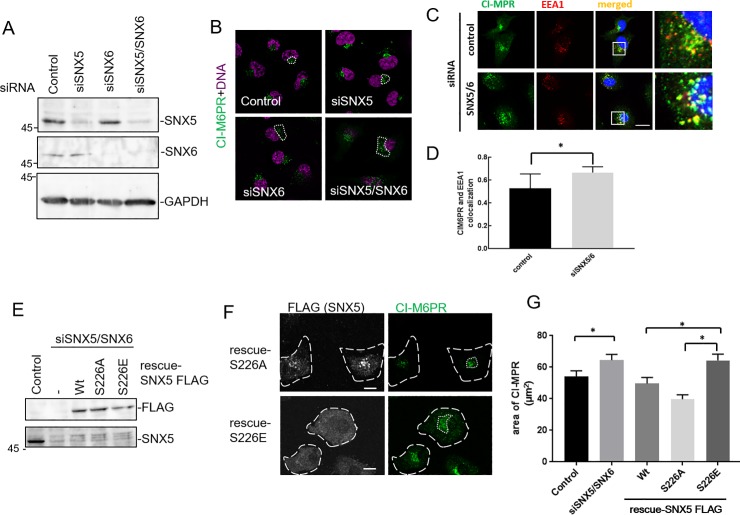
Fig 4. Effect of SNX5 S226 phosphorylation on the retrograde transport of CI-M6PR.
(A-D) 8505C cells were treated with control, SNX5, SNX6, SNX5/SNX6 siRNA for 72 h. (A) Cell lysates were immunoblotted with anti-SNX5, anti-SNX6, and anti-GAPDH antibodies. (B) The cells were stained with anti-CI-M6PR (green) and DAPI (magenta) and observed by confocal microscopy. The dotted lines indicate the diffuse area of CI-M6PR, which was decided after thresholding by image J. (C) The cells were stained with anti-CI-M6PR (green), anti-EEA1 (red) antibodies and DAPI (blue). The boxed region is magnified on the right. Scale bars indicate 10 μm. (D) The colocalization of CI-M6PR with EEA1 was quantified. The results shown are mean±SEM of 30 cells from three independent experiments. Asterisk indicates; p<0.05 by Student’s t-test. (E-G) 8505C cells were treated with control or SNX5/SNX6 siRNA for 48 h and then infected by adenovirus bearing rescue-FLAG-tagged SNX5 S226A or S226E. (E) After 24 h, cell lysates were immunoblotted with anti- FLAG and anti-SNX5 antibody. SNX5 derived from endogenous and transfection were indicated. (F) The cells were immunostained with anti-FLAG (gray) and anti-CI-M6PR (green) antibodies. The long-dashed lines express shape of the cells and dotted lines indicate the diffuse area of CI-M6PR. Scale bars indicate 10 μm. (G) The area of CI-M6PR in each cell are plotted. The results shown are mean±SEM of 127 cells from three independent experiments. Asterisk indicates; p<0.05 by Student’s t-test.

