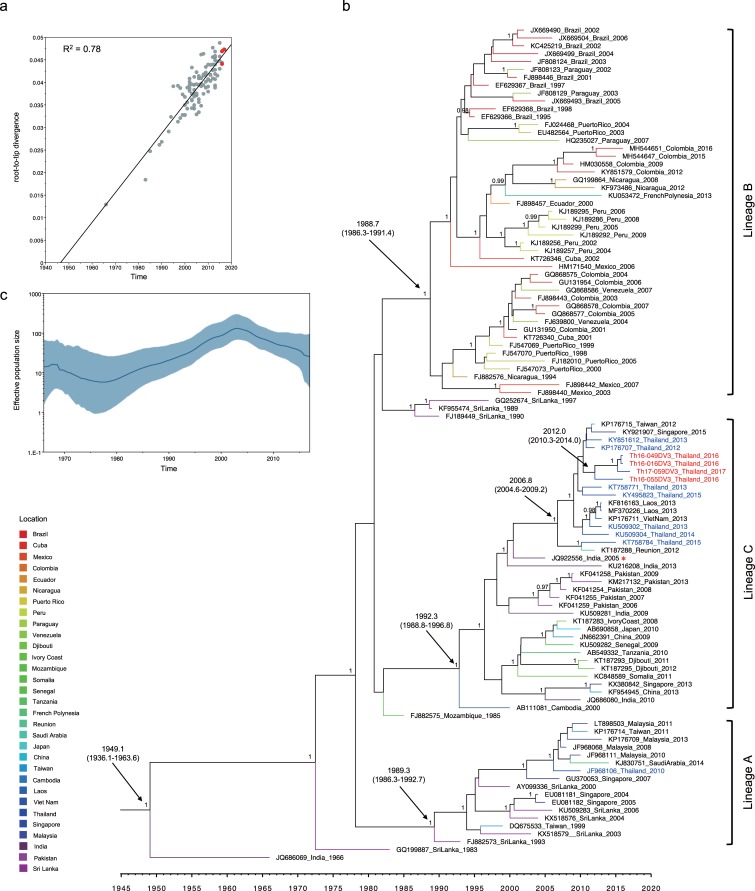
Fig 6.
Molecular clock analysis of DENV-3 genotype III envelope-encoding sequences (a) Correlation of collection year and divergence from maximum likelihood tree. The R2 (coefficient of determination) of 0.78 was estimated using TempEst (shown at top left). Red dots indicate sequences obtained in the present study. (b) Bayesian maximum clade credibility (MCC) phylogenetic tree estimated using BEAST v1.8.4. The terminal branch color indicates different geographical locations according to the legend at the bottom left corner of the figure. The mean time of the most recent common ancestor (tMRCA) and 95% highest probability density (HPD) (in calendar year and tenths of year) are indicated with black arrows, and posterior probability values are indicated adjacent to the node of interest. The name of each taxon is presented formatted as accession number, country, and year of collection. Sequences obtained in the present study are labeled in red, while Thailand sequences from GenBank are labeled in blue. Lineages A, B, and C are shown to the right. The JQ922556 virus is indicated by a red asterisk. (c) Demographic history of DENV-3 genotype III was inferred by a Gaussian Markov random field (GMRF) Skyride plot using Tracer 1.7.

