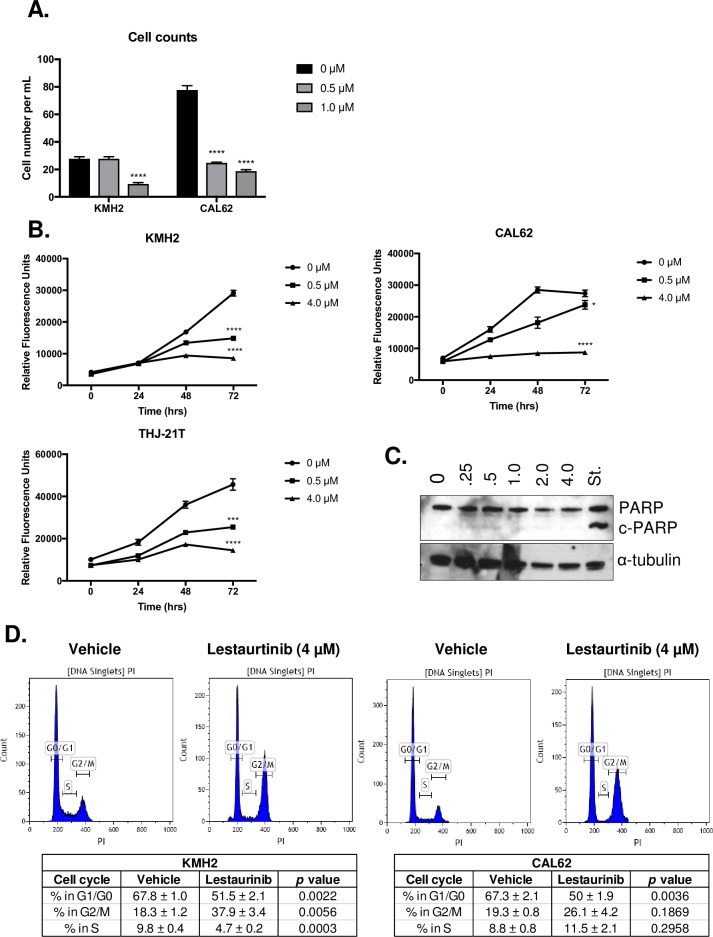
Fig 4. Lestaurtinib exhibited a cytostatic effect on ATC cells, in vitro.
(A) Effect of Lestaurtinib (0.5 μM and 1.0 μM) on cell number following 24 h of treatment (3 replicates per line) for KMH2 and CAL62 cell lines. (B) Growth curves for KMH2, CAL62 and THJ-21T cell lines following treatment with Lestaurtinib at 0, 24, 48 and 72 h, with 3 technical replicates per timepoint. Statistical analysis is shown for the 72 h timepoint when compared to the untreated control for the same timepoint. (C) Western blot showing expression of cleaved PARP (c-PARP) following 24 h of Lestaurtinib doses (0.25–4.0 μM) relative to the apoptosis-inducing Staurosporine (St.) control. (D) CAL2 and KMH2 cells were treated with Lestaurtinib (4.0 μM) for 24 h (3 replicates per line) prior to BrdU incorporation and labeling of cells with propidium iodide. A minimum of 10,000 events were counted per test. Proportions of cells within each phase of the cell cycle is shown ± standard error. * represents p < 0.05, ** represents p < 0.01, *** represents p < 0.001, **** represents p < 0.0001, ns = not significant, Student’s unpaired, two-tail t-test.

