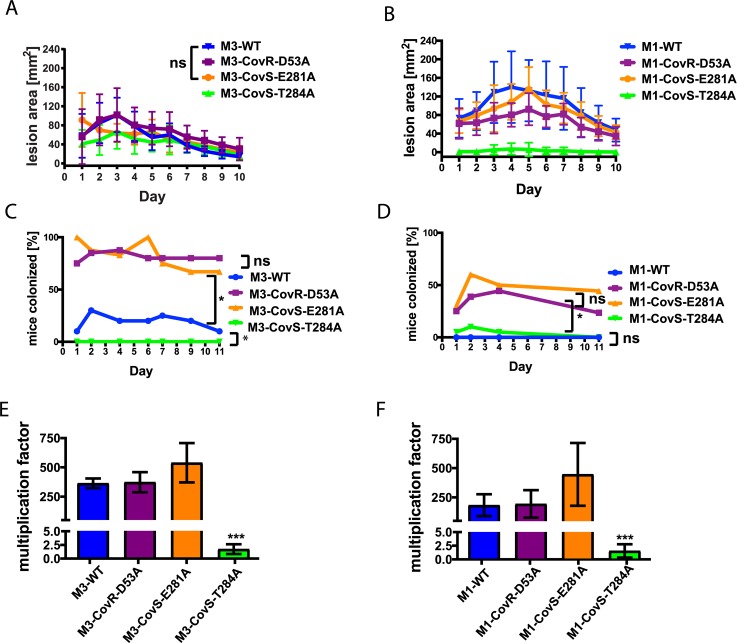
Fig 2. Influence of CovR~P levels on GAS virulence.
(A and B) Lesion size measurements after mouse skin/soft tissue infection with 107 CFU of indicated serotype M3 (A) and serotype M1 (B) GAS strains. 20 mice per strain were inoculated subcutaneously, and lesion areas were measured daily. Differences in lesion size between the GAS strains were statistically significant as measured by two-way ANOVA (P<0.05) with repeated measures unless otherwise noted; ns not significantly different. (C and D) Nasopharyngeal mouse model. Percentage (%) of mice colonized with the indicated serotype M3 (C) and serotype M1 (D) GAS strains on a given day. 20 mice per strain were inoculated via intranasal route with 1 x 10⁸ (M3) or 107 (M1) CFU, respectively. Throat swabs were taken regularly, and recovered bacteria were plated on BSA plates to detect and enumerate β-hemolytic GAS colonies. Statistical comparisons were performed via a mixed linear model with repeated measures.; *, difference statistically significant (P<0.05). (E and F) Multiplication factors for indicated serotype M3 (E) and serotype M1 (F) GAS strains after 3h incubation in whole human blood. Data graphed are average and mean ± standard deviation of three biological replicates. One-way ANOVA was performed to assess if there was a difference among the strains with post-hoc comparisons performed using Tukey’s adjustment for multiple comparisons. *** P≤0.001.

