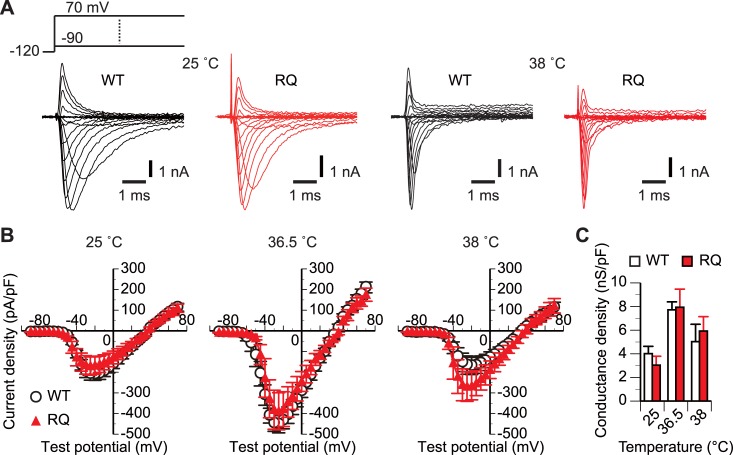
Fig 1. SCN5A(R1193Q) did not affect the whole-cell conductance at any tested temperature.
(A and B) Representative traces (A) and mean I-V plots (B) of INa of WT and RQ cells continuously perfused with bath solutions at the indicated temperatures. Schematic in panel A shows the voltage protocol. The test potential was incremented in 5-mV steps. For simplicity, current responses to some test potentials are omitted from the traces. n, 10–11 WT cells and 9–11 RQ cells for each condition. Error bars indicate ±SEM throughout the figures unless otherwise stated. (C) Comparison of mean whole-cell conductance densities estimated from the slope of the linear region of the I-V plot for each cell. p>0.05 between WT and RQ cells for all temperatures (unpaired t-test).

