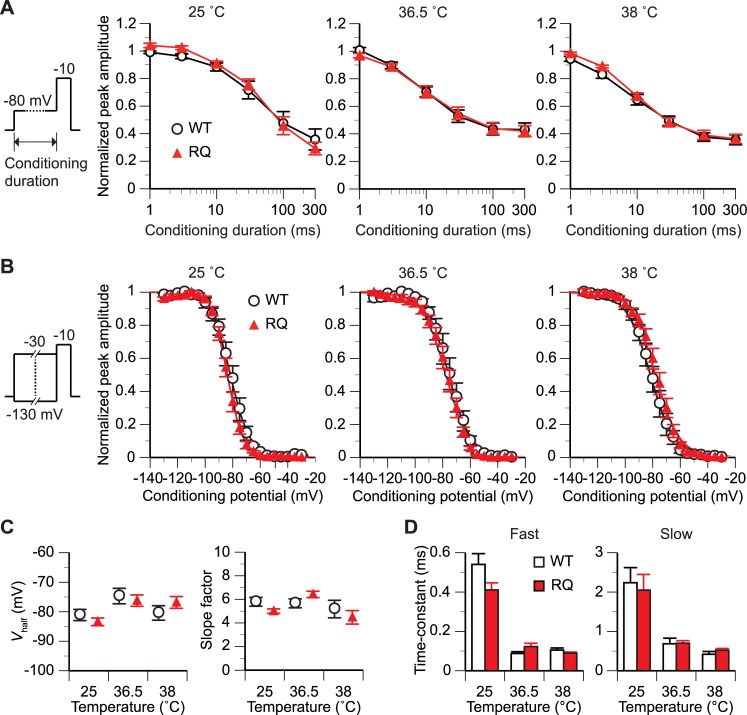
Fig 3. SCN5A(R1193Q) did not affect the inactivation gating at any tested temperature.
(A) The time dependence of inactivation was measured with a double-step voltage protocol (schematic in panel A; holding potential, -120 mV). The duration of the conditioning step varied from 0 to 300 ms. The duration of the test step was 20 ms. The graph plots the peak amplitude of INa evoked at the test step against the duration. The amplitude is expressed relative to that with a conditioning duration of 0 ms. p>0.05 between WT and RQ cells [repeated measures analysis of variance (rmANOVA)]. n, 5 WT and 5 RQ cells for each data point. (B and C) The voltage dependence of inactivation was measured with a double-step voltage protocol (schematic in panel B; holding potential, -120 mV). The conditioning step was fixed at 500 ms in duration and varied from –130 to –30 mV in voltage. The duration of the test step was 20 ms. (B) The graph plots the relative peak amplitude of INa evoked at the test step against the conditioning voltage. n, 8–10 WT and 8–13 RQ cells for each condition. The Boltzmann sigmoidal function was fitted to the data from all tested cells for each condition. (C) Comparison of the mean Vhalf and slope factor estimated from the Boltzmann function fitted to the g-V plot for each cell. p>0.05 between WT and RQ cells for all temperatures (unpaired t-test). (D) Comparison of mean time constants of the fast and slow components of INa decay. The values were estimated from the double-exponential function fitted to the decaying phase of INa evoked at a test potential of –20 mV for each cell (Fig 1A). p>0.05 between WT and RQ cells for all temperatures (unpaired t-test). n, 5–11 WT and 7–8 RQ cells for each condition.

