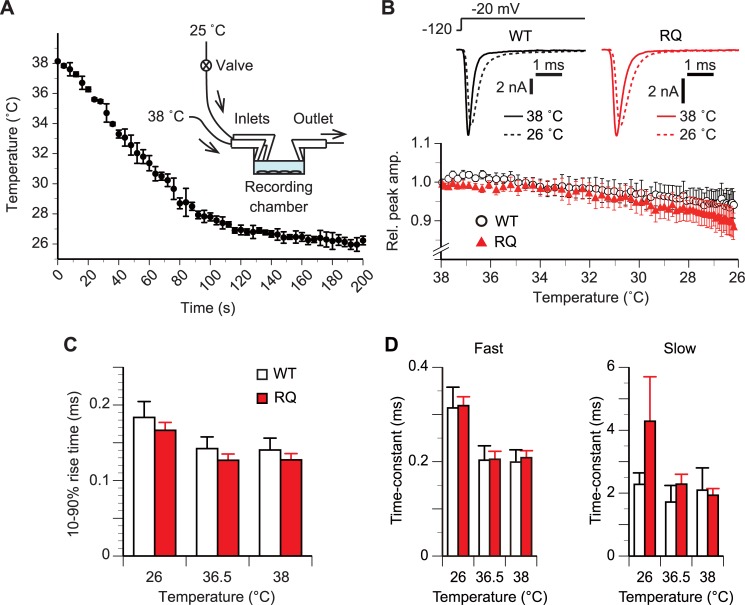
Fig 5. SCN5A(R1193Q) did not alter the amplitude or gating in response to an acute change of temperature.
(A) Mean time course of the temperature at the center of the recording chamber after starting the additional influx of room-temperature bath solution. Error bars, ±SD. n, 5 trials. Inset, schematic of the experimental set up. The recording chamber was perfused with pre-heated bath solution (38°C) throughout the measurement. (B) Time course of the mean relative peak INa amplitude along with a temperature change from 38°C to 26°C. In panels B–D, INa repeatedly evoked at a test potential of –20 mV in a 2-s interval were analyzed. Holding potential, –120 mV. For each cell, the peak amplitude was normalized to the basal value obtained prior to the lowering of the temperature. p>0.05 between WT and RQ cells (rmANOVA). n, 8 WT and 8 RQ cells. Inset, representative current responses of single WT and RQ cells at labeled temperatures. (C) Comparison in mean 10%–90% rise time. p>0.05 between WT and RQ cells for all tested temperatures (rmANOVA, unpaired t-test). n, 8 WT cells and 8 RQ cells. (D) Comparison of mean time constants of fast and slow components of the double-exponential function fitted to the decaying phase of INa. p>0.05 between WT and RQ cells for all tested temperatures (rmANOVA, unpaired t-test). n, 7 WT cells and 7 RQ cells.

