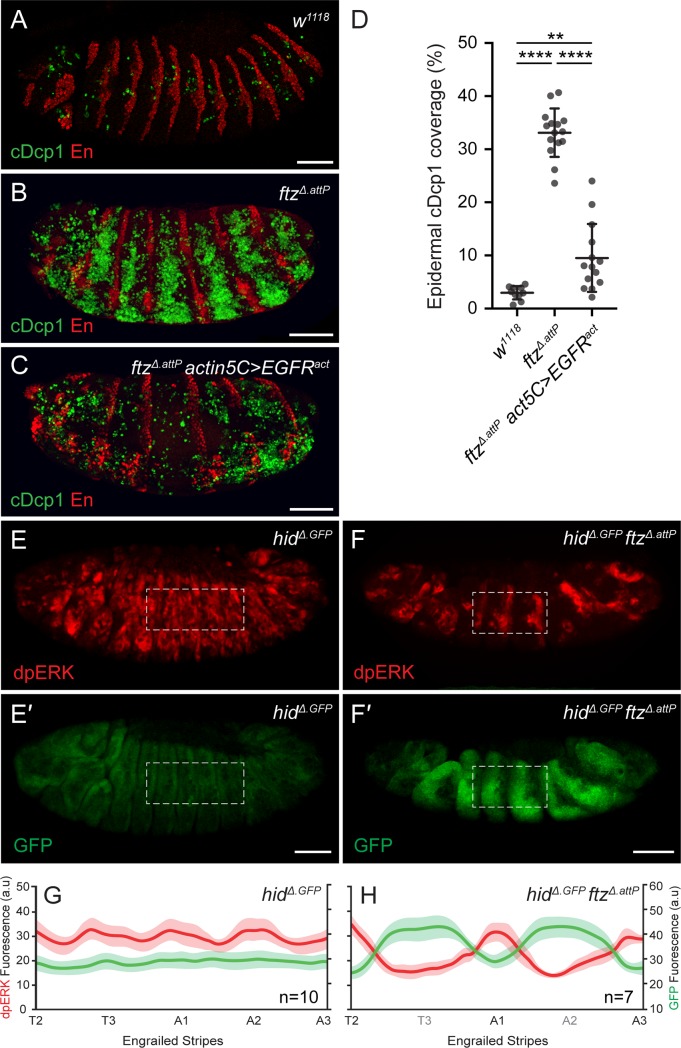
Fig 2. Loss of EGFR signaling and hid up-regulation in ftz mutants.
(A–D) cDcp1 immunoreactivity in control w1118 (A), ftzΔ.attP (B), and ftzΔ.attP actin5C-Gal4, UAS–EGFRact (C) stage 13/14 embryos. (D) Quantification of mean cDcp1 levels for genotypes shown in A–C. Error bars display standard deviation (***p < 0.001, **p < 0.01, unpaired Student t test). (E, F) dpERK/GFP immunoreactivity in stage 13 hidΔ.GFP single mutant (E, E′) and hidΔ.GFP ftzΔ.attP double mutant embryos (F, F′). Dashed line indicates representative region of interest for quantification in panels G and H. Scale bars 50 μm. (G, H) Mean dpERK (red) and GFP (green) fluorescence intensity profiles in control hidΔ.GFP (G) and hidΔ.GFP ftzΔ.attP (H) samples. Engrailed expression stripes were used as a spatial marker along the A/P axis (see material and methods). Shaded areas depict standard error of the mean. The underlying data for (D), (G) and (H) can be found in S1 Data. cDcp1, cleaved Death caspase-1; dpERK, phosphorylated Extracellular signal–regulated kinase; EGFR, epidermal growth factor receptor; ftz, fushi-tarazu; GFP, green fluorescent protein; hid, head involution defective; UAS, upstream activation sequence; w1118, white1118.

