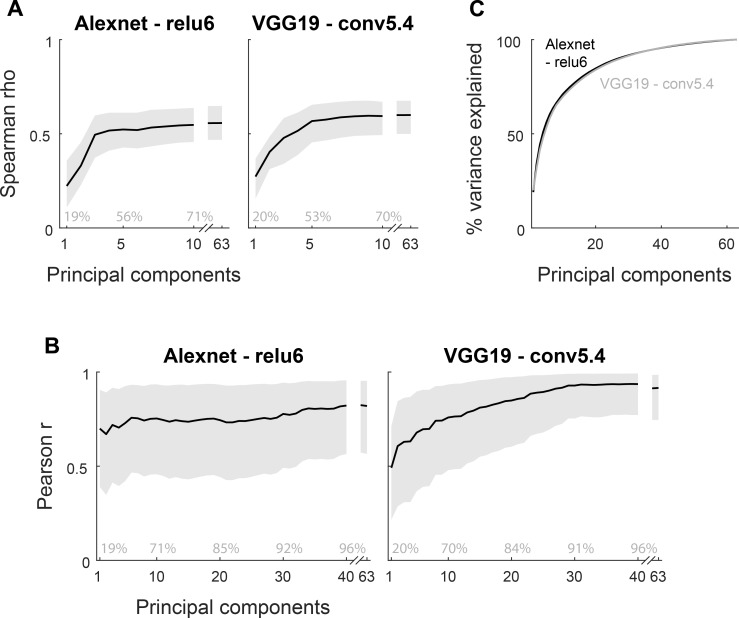
Fig 7. Similarities between IT and CNN peak layer shape dissimilarities as a function of retained principal components.
(A) Spearman rank correlation coefficients between IT and peak CNN layer similarities are shown for each of two CNN models as a function of retained principal components of the CNN layer activations. The dissimilarities were Euclidean distances. Error bands depict 95% confidence intervals, determined by 10,000 bootstrap samples of the IT neuronal pool. (B) The cumulative proportion of explained variance as a function of principal component number for the Alexnet (black line) and VGG-19 layer (gray line). (C) Pearson correlation coefficients between the mean neural distances and the mean distances of the peak CNN layer (n = 6 mean distances; see Fig 10) as a function of retained principal components. In A and C, the bands represent 95% confidence intervals, determined by 10,000 bootstrap samples of the IT neuronal pool.

