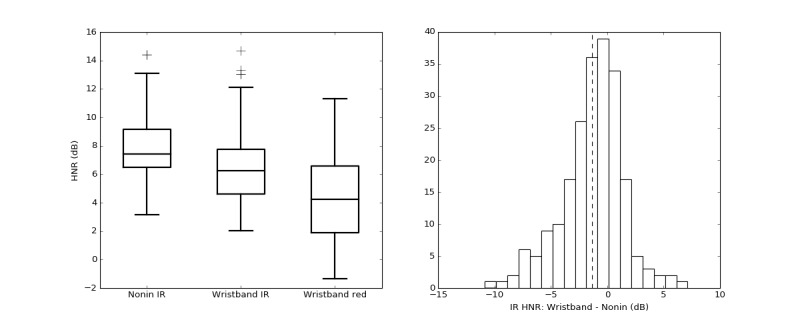
Figure 5.

Boxplot comparison (left) of average harmonic-to-noise ratio (HNR) estimated over 60-second nonoverlapping windows for each photoplethysmography wavelength: Nonin finger-clip pulse oximeter (Nonin IR), the wristband infrared (Wavelet IR), and the wristband red (Wavelet red). The histogram for pairwise difference of average HNR between Wavelet IR and Nonin IR signals (right). IR: infrared.
