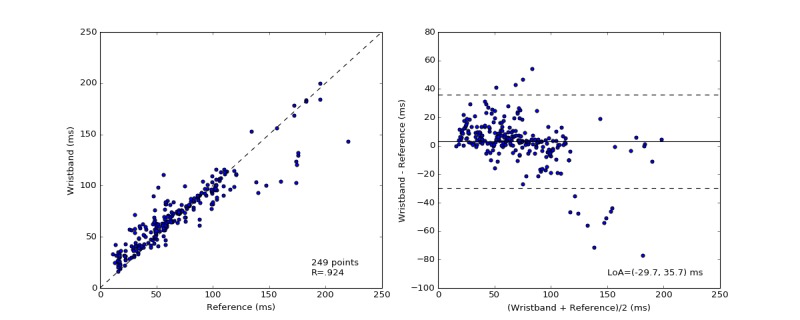
Figure 8.

The distribution of measured heart rate variability root mean square of successive differences (HRV RMSSD) by the electrocardiography (ECG) and the wristband (left). The Pearson correlation coefficient is shown in the lower-right corner of this scatter plot. Bland-Altman plots of the absolute error of HRV between the wristband and the simultaneously recorded ECG measurements versus the mean of the measurements in milliseconds (right). The solid black line indicates the mean difference. The dotted lines mark the 95% limit of agreement (LoA) at −30 and 36 ms.
