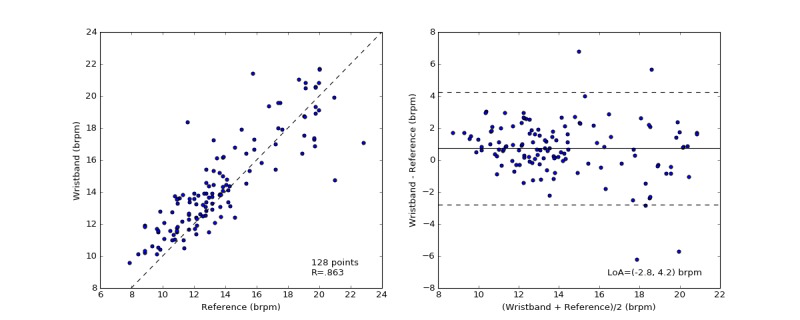
Figure 9.

The distribution of measured respiration rate (RR) by spirometer and the wristband (left). Each data point represents the average RR over a 60-second nonoverlapping measurement window. Bland-Altman plots of the absolute error of RR between the wristband and the simultaneously recorded control measurements versus the mean of the measurements in breaths per minute (right). The solid black line indicates the mean difference. The dotted lines mark the 95% limit of agreement (LoA) at −3 and 4 brpm.
