. 2018 Oct 29;7:e38829. doi: 10.7554/eLife.38829

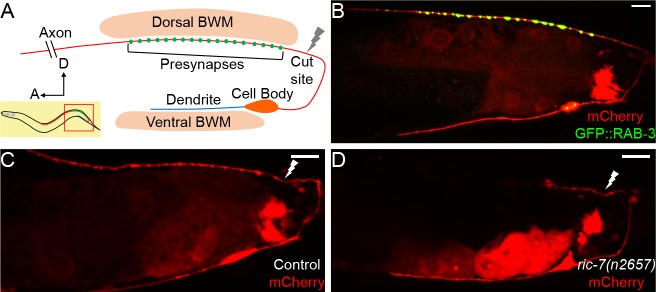
Figure 1. DA9 axon regeneration and degeneration.

(A) Diagram of DA9 morphology and the laser cutting site. (B) A control adult expressing GFP::RAB-3 and mCherry in DA9. mCherry expression is also observed in the posterior gut in these micrographs. (C) A control animal 12 hr after axotomy. The distal axon fragment remains and overlaps with the regenerating axon. The white lightning mark indicates the axotomy site. (D) A ric-7(n2657) animal 12 hr after axotomy. The distal fragment has degenerated. Scale bars = 10 µm.

Figure 1.

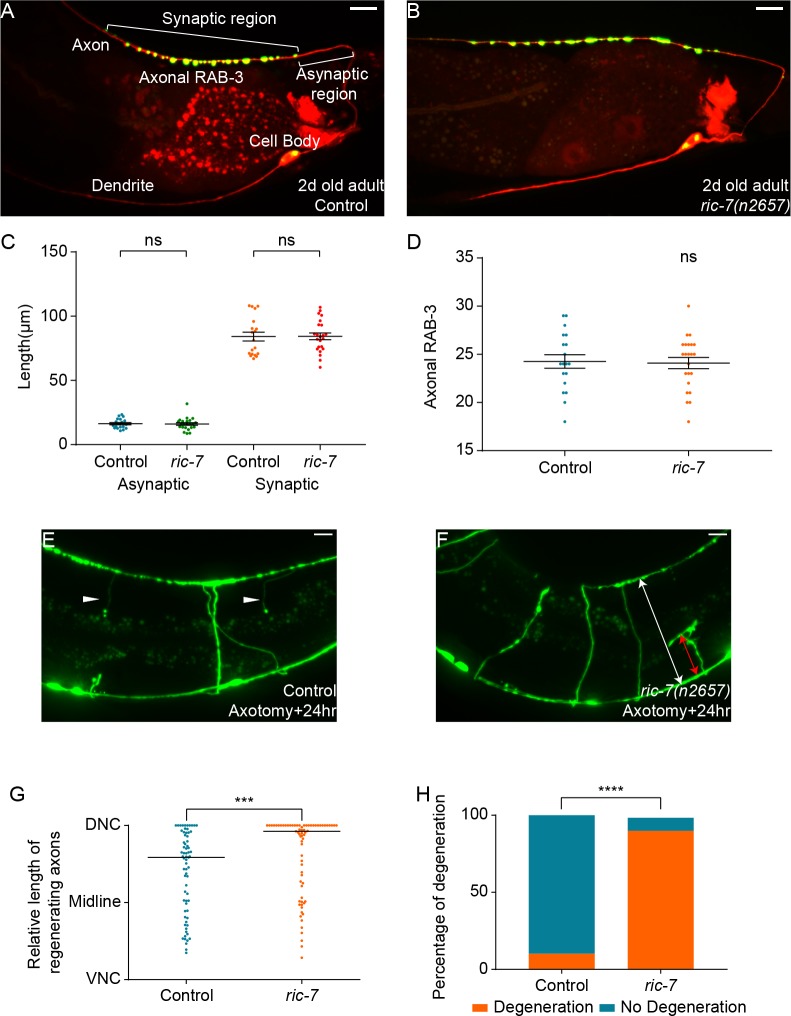
Figure 1—figure supplement 1. ric-7(n2657) animals show normal DA9 development, better regeneration and increased degeneration of GABA motor neurons.

Figure 1—figure supplement 1.

(A and B) GFP::RAB-3 and mCherry labeling in DA9 of control (A) and ric-7(n2657) (B) animals (2-day-old adults). Scale bars = 10 µm. (C) Length of the asynaptic region and the synaptic region in control and ric-7(n2657) animals (2-day-old adults). Mean ± SEM. ns, not significant. Unpaired t test. (D) Number of axonal RAB-3 puncta in control and ric-7(n2657) animals (2-day-old adults). Mean ± SEM. ns, not significant. Unpaired t test. (E and F) Regeneration and degeneration of GABA motor neurons in control (E) and ric-7(n2657) (F) animals 24 hr after axotomy. White arrowheads point to the remaining distal axon segments in control (E) which have degenerated in ric-7(n2657) (F). The red line in (F) indicates the length of the regenerating axon along the dorsal-ventral axis and the white line indicates the width of the animal. Scale bars = 10 µm. (G) Relative length of regenerating axons (the ratio of the length of red line and white line in (F)) in control and ric-7(n2657) animals 24 hr after axotomy. Black line is median. ***p<0.0001. χ2 test.