. 2018 Oct 29;7:e38829. doi: 10.7554/eLife.38829

Figure 2. DA9 forms normal and dendritic synapses during regeneration.

(A) Diagram of a regenerated DA9 axon. (B–D) DA9 axonal and synaptic regeneration at different timepoints after axotomy. The white lightning mark indicates the axotomy site. Scale bars = 10 μm. (E) Number of axonal RAB-3 puncta at different timepoints with or without axotomy. Mean ± SEM. *p<0.05; **p<0.01; ****p<0.0001; ns, not significant. Unpaired t test for comparisons between two groups and one-way ANOVA for more than two groups. (F) Length of the asynaptic and the synaptic region in intact and axotomized animals 48 hr after axotomy. Mean ± SEM. ****p<0.0001; ns, not significant. Unpaired t test. (G and H) Total axon length and number of dendritic RAB-3 puncta at different timepoints with or without axotomy. Mean ± SEM. ***p<0.001; ****p<0.0001; ns, not significant. Unpaired t test for comparisons between two groups and one-way ANOVA for more than two groups.

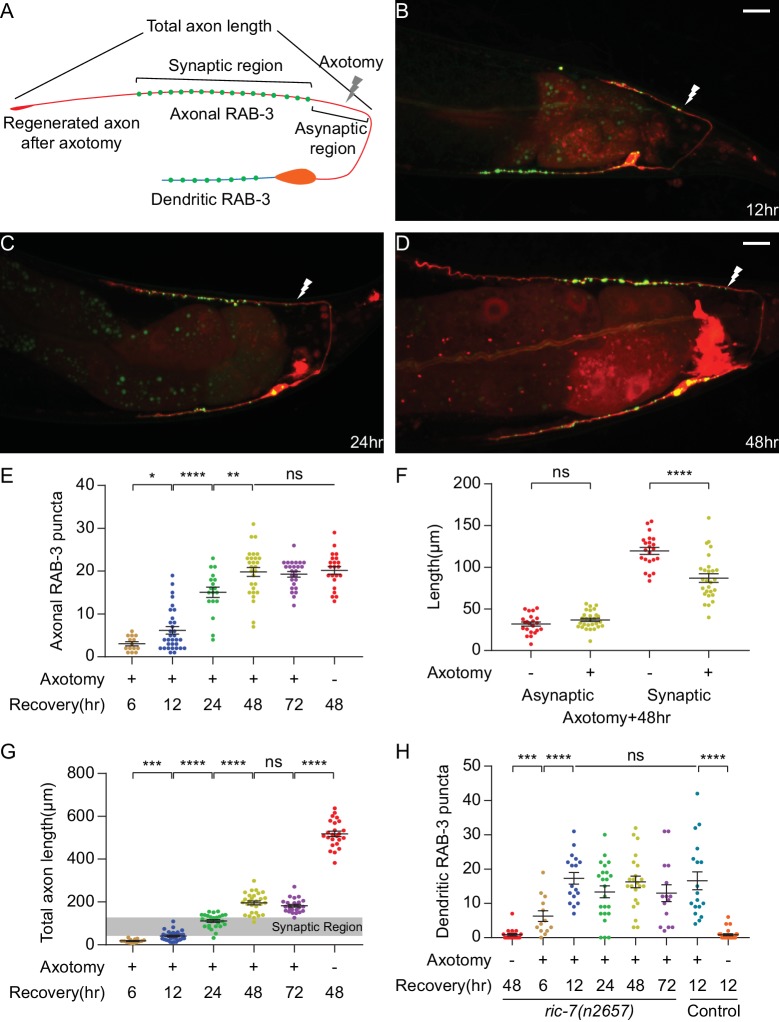
Figure 2.

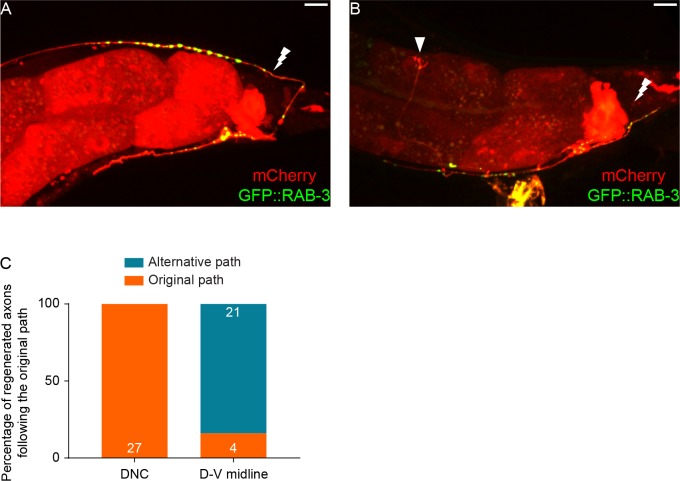
Figure 2—figure supplement 1. Axotomy in the DNC enables accurate axon growth following the original path.

Figure 2—figure supplement 1.

(A) DA9 regeneration 48 hr after axotomy in the DNC. The lightning mark indicates the cutting site. The scale bar = 10 μm. (B) DA9 regeneration 48 hr after axotomy in the dorsal-ventral midline of the commissure. The lightning mark indicates the cutting site. The arrowhead indicates the growth cone. The scale bar = 10 μm. (C) Quantification of regenerated DA9 axons following the original axon path or an alternative path. The number indicates number of animals.
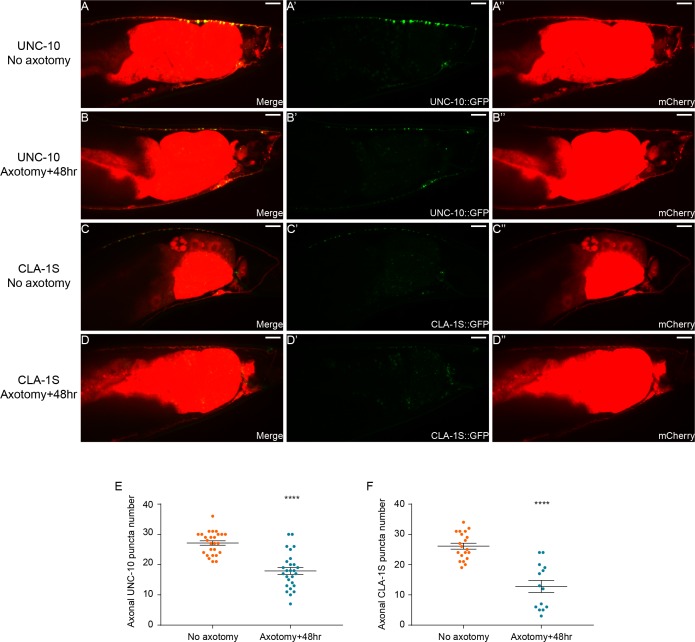
Figure 2—figure supplement 2. Regeneration of other presynaptic components.

Figure 2—figure supplement 2.

(A–A’’) UNC-10 localization in intact DA9. Scale bars = 10 μm. (B–B’’) UNC-10 localization in regenerated DA9. Scale bars = 10 μm. (C–C’’) CLA-1S localization in intact DA9. Scale bars = 10 μm. (D–D’’) CLA-1S localization in regeneration DA9. Scale bars = 10 μm. (E) Quantification of axonal UNC-10 puncta number. ****, p<0.0001. Unpaired t test. (F) Quantification of axonal CLA-1S puncta number. ****, p<0.0001. Unpaired t test.