. 2018 Oct 26;7:e37344. doi: 10.7554/eLife.37344

Figure 1. Overview of the project.

(A) Overview of genome-wide assays and time points of developmental and ageing samples. For development samples, chromatin accessibility, transcription initiation, productive elongation, and chromatin state were profiled in six stages of wild-type animals (embryos, four larval stages, young adults). For ageing samples, chromatin accessibility and productive transcription elongation were profiled in five time points of sterile adult glp-1 mutants (Day 1/Young adult, Day 2, Day 6, Day 9, Day 13). (B) Representative screen shot of normalized genome-wide accessibility profiles in the eleven samples (chrIII:9,041,700–9,196,700, 154 kb).

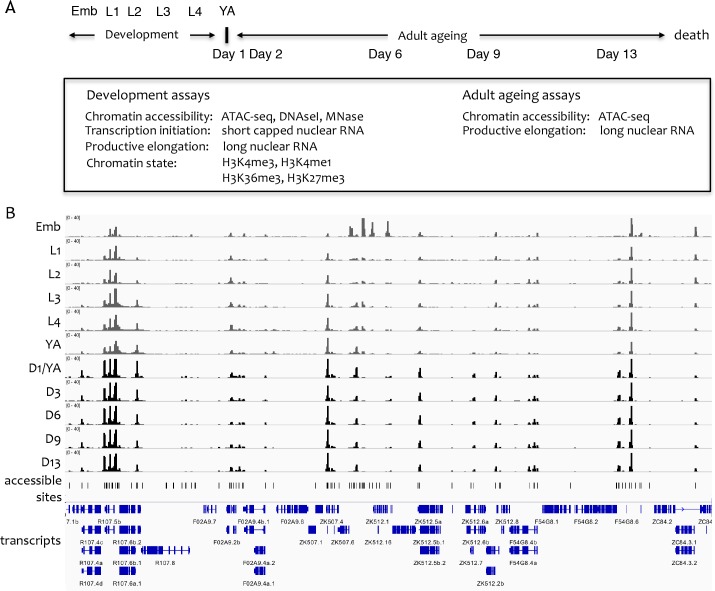
Figure 1—source data 1. Accessible sites identified using ATAC-seq.
● chrom_ce10, start_ce10, end_ce10 location of the accessible site (bed-style coordinates, ce10). ● atac_%stage_height maximum SPMR-normalized ATAC-seq signal at the peak in %stage (one of wt_emb, wt_l1, wt_l2, wt_l3, wt_l4, wt_ya, glp1_d1, glp1_d2, glp1_d6, glp1_d9, glp1_d13). ● atac_source source of the ATAC-seq peak call (see Materials and methods). ○ atac_wt_pe wt (developmental) ATAC-seq treated as paired-end. ○ atac_wt_se wt (developmental) ATAC-seq treated as single-end. ○ atac_glp1_se glp-1 (ageing) ATAC-seq, single-end only.
DOI: 10.7554/eLife.37344.006

Figure 1.

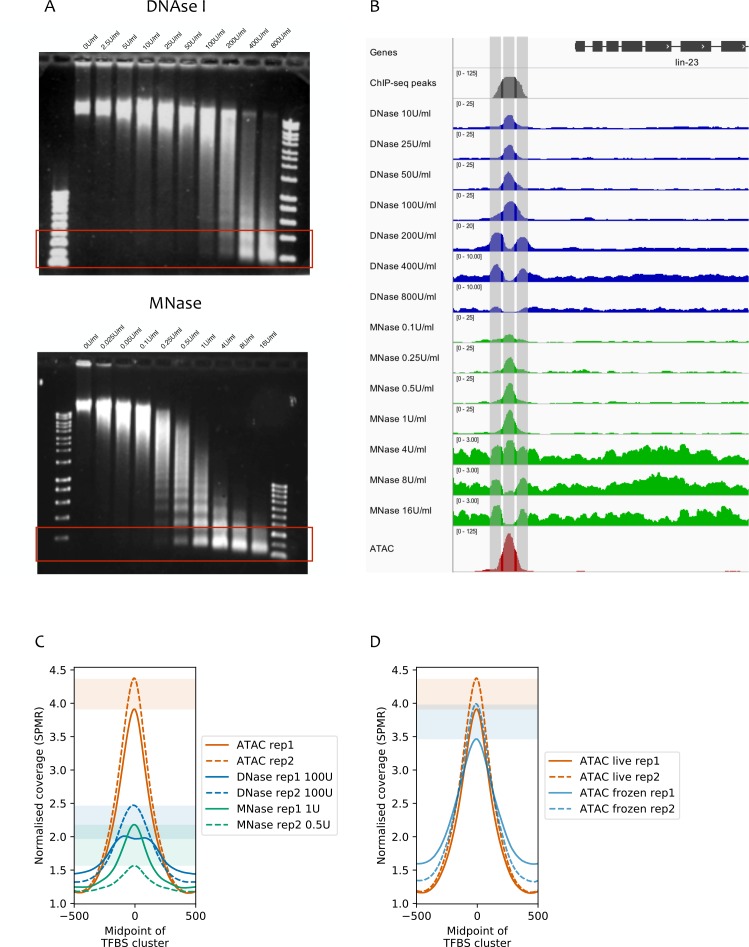
Figure 1—figure supplement 1. Comparison of ATAC-seq to concentration courses of DNase I-seq and MNase-seq.

Figure 1—figure supplement 1.

(A) Genomic DNA digested using different concentrations of DNase I (top) or MNase (bottom). Red rectangles highlight approximate size ranges subjected to paired-end Illumina sequencing. (B) SPMR-normalized coverage of a DNase I concentration series (blue tracks), MNase concentration series (green tracks), and ATAC-seq (red track) at the lin-23 locus (chrII:6,369,650–6,373,750, 4.1 kb). The modENCODE/modERN ChIP-seq peak call pileup (grey track) shows a TF binding region upstream of the gene. Different concentrations of nuclease show different types of signal. Low concentrations of DNase I and MNase produce a peak in the middle of the TF-binding region, at the expected NDR (middle vertical bar). At higher concentrations, both enzymes show a peak at the −1 and +1 nucleosomes (left and right vertical bars). ATAC-seq has a single large peak centered in the middle of the TF-binding region. (C) Mean normalized coverage at transcription factor binding sites defined by clustering modENCODE/modERN peak calls (n = 36,389; Materials and methods) in ATAC-seq, DNase-seq, and MNase-seq (the latter two are shown at concentrations with the highest accessibility enrichment). ATAC-seq shows higher signal than DNase-seq or MNase-seq. Shaded rectangles show the range of signal between assay replicates at the midpoint of the TFBS cluster. (D) Normalized read coverage of ATAC-seq prepared from nuclei harvested from live (red), or frozen (blue) embryos. Shaded rectangles are used as in (C).
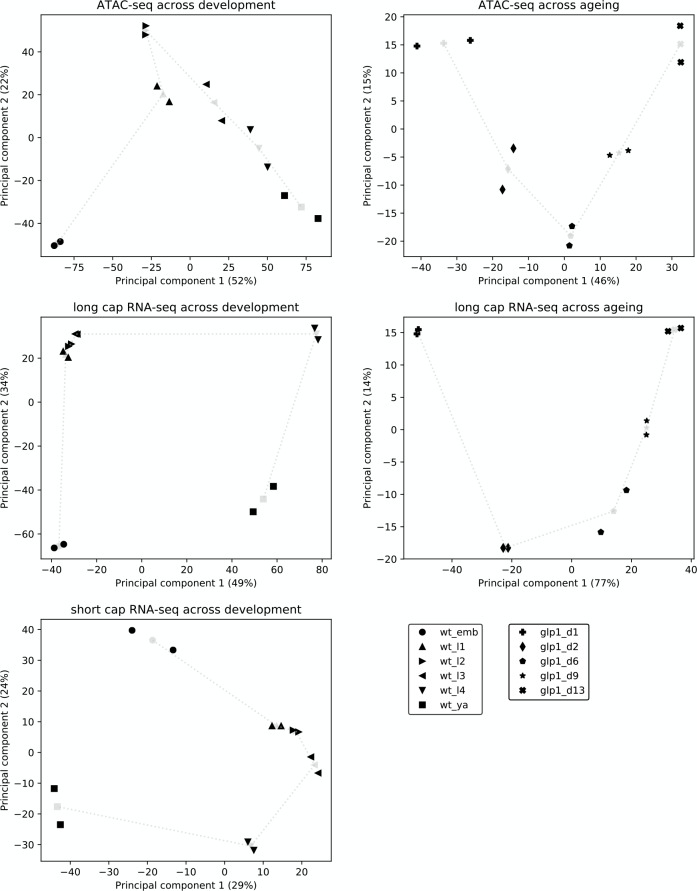
Figure 1—figure supplement 2. Reproducibility and broad relatedness of ATAC-seq and RNA-seq data.

Figure 1—figure supplement 2.

Reproducibility and broad relatedness of the different samples and time points in ATAC-seq (top), long cap RNA-seq (middle), and short cap RNA-seq (bottom). We applied PCA to peak accessibility at promoters (ATAC-seq), read counts at annotated genes (long cap RNA-seq), and 5' end read counts at promoters (short cap RNA-seq). Black markers show different biological samples (two per time point) whereas gray markers show centroids, calculated by averaging the two samples collected at the same time point. Gray dotted lines show the time progression across development or ageing.
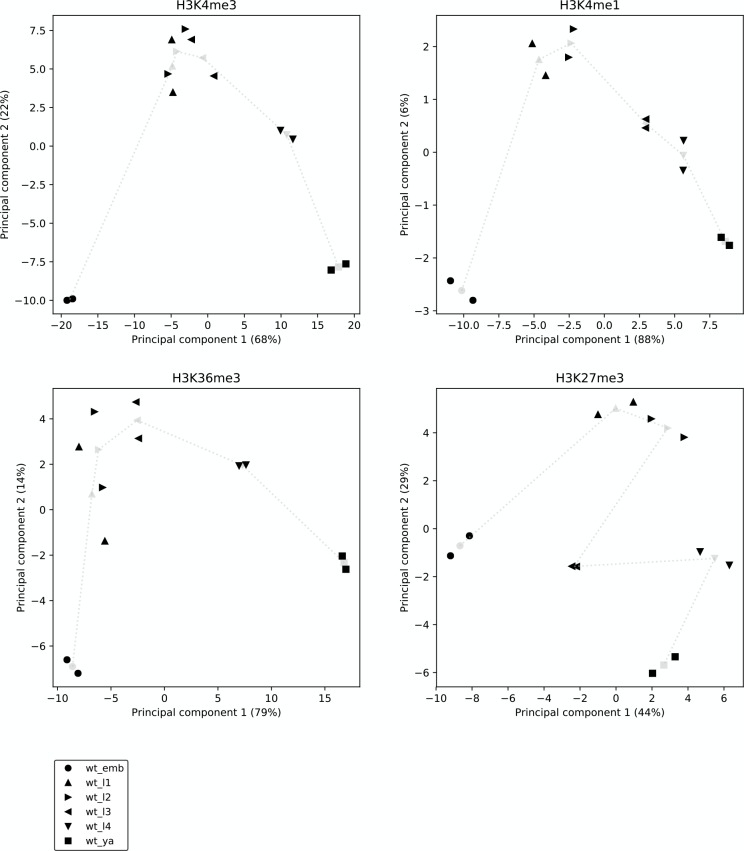
Figure 1—figure supplement 3. Reproducibility and broad relatedness of the histone modification data.

Figure 1—figure supplement 3.

Reproducibility and broad relatedness of the different samples and time points in H3K4me3 (top left), H3K4me1 (top right), H3K36me3 (bottom left), and H3K27me3 ChIP-seq (bottom right). We applied PCA to genic regions, from the most upstream promoter to the annotated 3' end, considering genes with at least one promoter. Black markers show different biological samples (two per time point), whereas gray markers show centroids, calculated by averaging the two samples collected at the same time point. Gray dotted lines show the time progression across development.