. 2018 Oct 26;7:e37344. doi: 10.7554/eLife.37344

Figure 2. Annotation of accessible elements.

(A) Top, strand-specific nuclear RNA in each developmental stage monitors transcription elongation; plus strand, blue; minus strand, red. Below is transcription initiation signal, accessible elements (colored by annotation), and gene models (chrI:12,675,000–12,683,400, 8.4 kb). The left side of each element is colored by the reverse strand annotation whereas the right side of an element is colored by the forward strand annotation (color key at bottom). (B) Left, distribution of accessible sites in four categories: promoters (one or both strands), putative enhancers, no activity, or overlapping a tRNA, snRNA, snoRNA, rRNA, or miRNA. Right, distribution of different types of promoter annotations. (C) Left, distribution of the number of promoters and enhancers per gene; right, boxplot shows that genes with more promoters also have more enhancers.

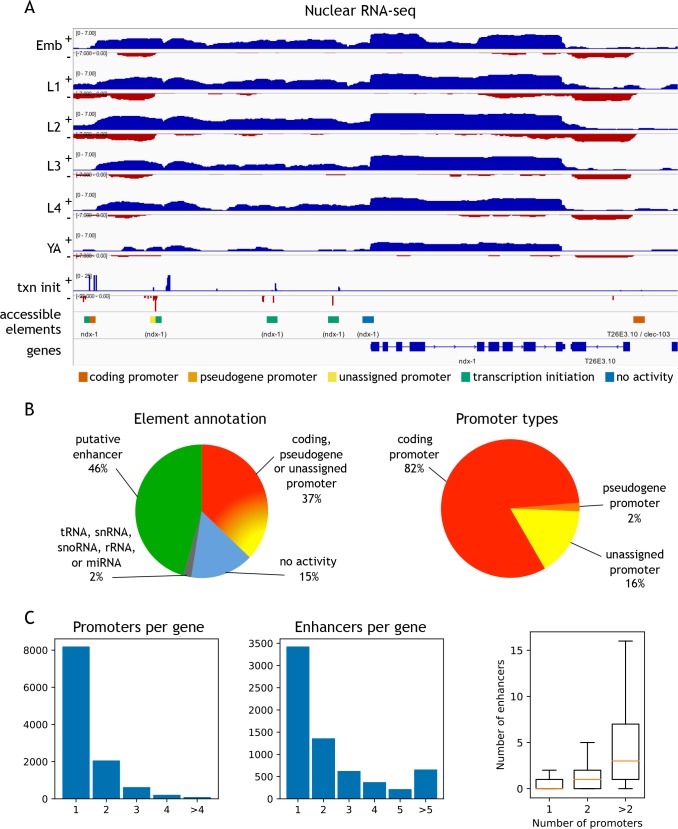
Figure 2—source data 1. Regulatory annotation of accessible sites.
● chrom_ce10, start_ce10, end_ce10 location of the accessible site (bed-style coordinates, ce10). ● chrom_ce11, start_ce11, end_ce11 as above, but lifted over to ce11. ● annot final regulatory element type, obtained by combining strand-specific transcription patterns (see Materials and methods). ● annot_%strand annotation of the strand-specific transcription patterns at the site (%strand is either fwd or rev). ● promoter_gene_id_%strand, promoter_locus_id_%strand, promoter_gene_biotype_%strand WormBase gene id, locus id, biotype for sites annotated as coding_promoter, pseudogene_promoter or non-coding_RNA on %strand. ● associated_gene_id, associated_locus_id WormBase gene id, locus id of genes whose gene body or outron region overlaps the site. These are defined for for sites annotated as unassigned_promoter, putative_enhancer or other_element. If a site overlaps multiple genes, all overlaps are reported, separated by commas. ● tss_%strand_ce10 representative transcription initiation mode (Materials and methods) on %strand, ce10 coordinates. ● tss_%strand_ce11 as above, but lifted over to ce11. ● scap_%strand_passed True or False based on whether the site has reproducible transcription initiation (Materials and methods). ● lcap_%stage_%strand_passed_jump True or False based on whether the site passed the jump test for elongating transcription (Materials and methods, %stage is one of wt_emb, wt_l1, wt_l2, wt_l3, wt_l4, wt_ya, glp1_d1, glp1_d2, glp1_d6, glp1_d9, glp1_d13). ● lcap_%stage_%strand_passed_incr True or False based on whether the site passed the incr test for elongating transcription (Materials and methods).
DOI: 10.7554/eLife.37344.014

Figure 2.

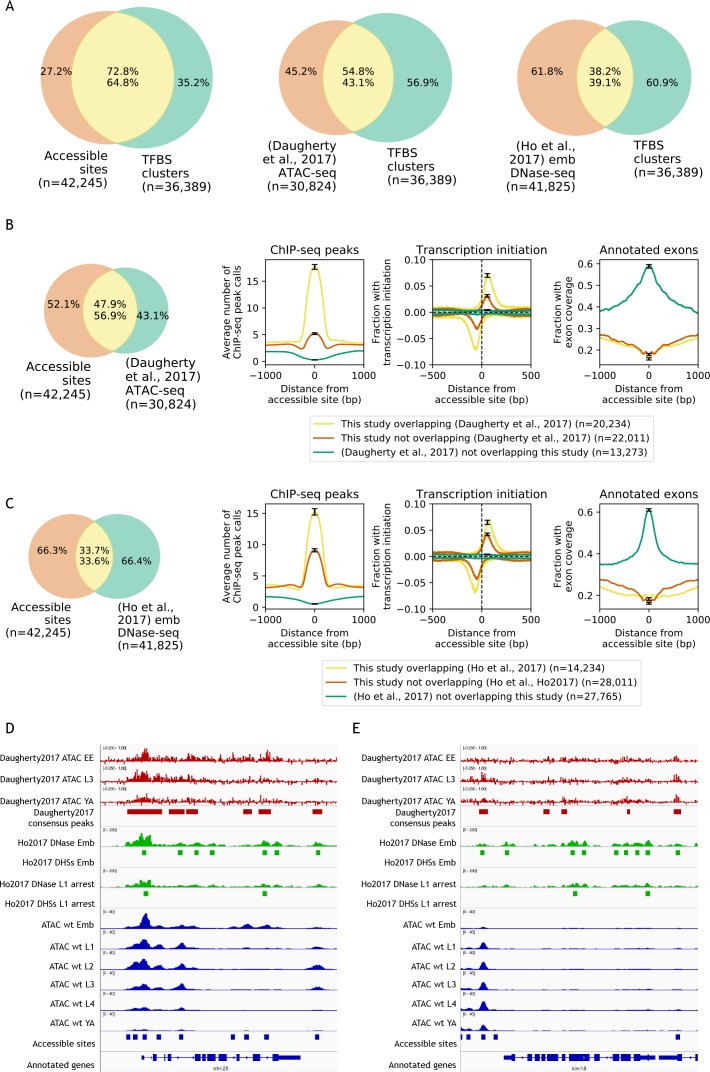
Figure 2—figure supplement 1. Comparisons to previous accessibility maps.

Figure 2—figure supplement 1.

(A) Venn diagrams showing the overlap of transcription factor binding sites defined by clustering modENCODE/modERN peak calls (n = 36,389; Materials and methods) to accessible sites from this study and two previous studies (Daugherty et al., 2017; Ho et al., 2017). (B) Comparison of accessible sites defined in this study to accessible sites defined in Daugherty et al. (2017). (C) Comparison of accessible sites defined in this study to accessible sites defined in Ho et al. (2017). (B,C) Leftmost plot shows overlaps between accessible sites. Rightmost three plots compare regions found in both studies or unique to only one study, for mean profile of modENCODE/modERN peak call pileup, fraction of sites with transcription initiation signal (negative values are reverse strand signals), and fraction overlapping an exon. (D,E) IGV screenshots (D: nhr-25, chrX:13,007,000–13,015,000, 8 kb; E: kin-18, chrIII:6,117,000–6,125,500, 8.5 kb) of stage-specific accessibility profiles and peak calls from Daugherty et al. (2017) (top, red), (Ho et al., 2017) (middle, green), and this study (bottom, blue).
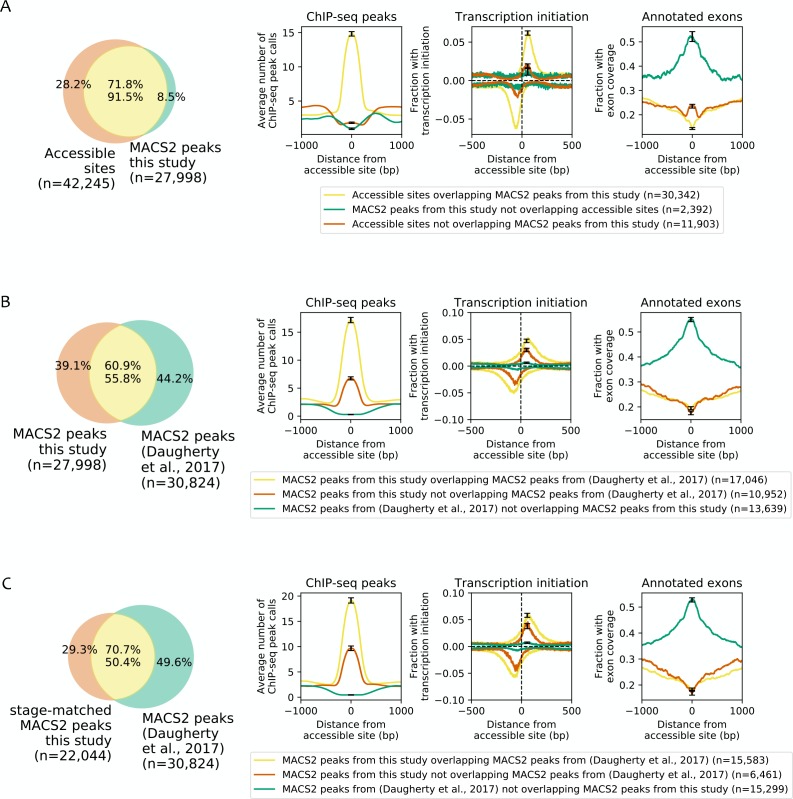
Figure 2—figure supplement 2. Effect of differences in peak calling methods on the types of identified accessible sites.

Figure 2—figure supplement 2.

As done by Daugherty et al. (2017), MACS2 was used to call peaks on the ATAC-seq data reported here using MACS2 parameters --shift −75 --gsize ce -q 5e-2 --nomodel --extsize 150 --bdg --keep-dup all --call-summits --SPMR. Peaks from biological replicates of the same stage were combined by intersecting peak calls from the two biological replicates, and then peaks from each stage were combined by taking their union. This identified 27,998 peaks used for this analysis. (A) Comparison between accessible regions identified by the focal enrichment peak calling method used in this study (n = 42,245) to those defined using MACS2 (n = 27,998). (B) Comparison of ATAC-seq MACS2 peak calls from our data to ATAC-seq MACS2 peak calls from (Daugherty et al., 2017). (C) Comparison of stage-matched ATAC-seq MACS2 peak calls from our data to ATAC-seq MACS2 peak calls from Daugherty et al. (2017). (A–C) Leftmost plots show overlaps between accessible sites. Rightmost three plots compare regions found in both sets of peak calls or unique to only one set, for mean profile of modENCODE/modERN peak call pileup, fraction of sites with transcription initiation signal (negative values are reverse strand signals), and fraction overlapping an exon.
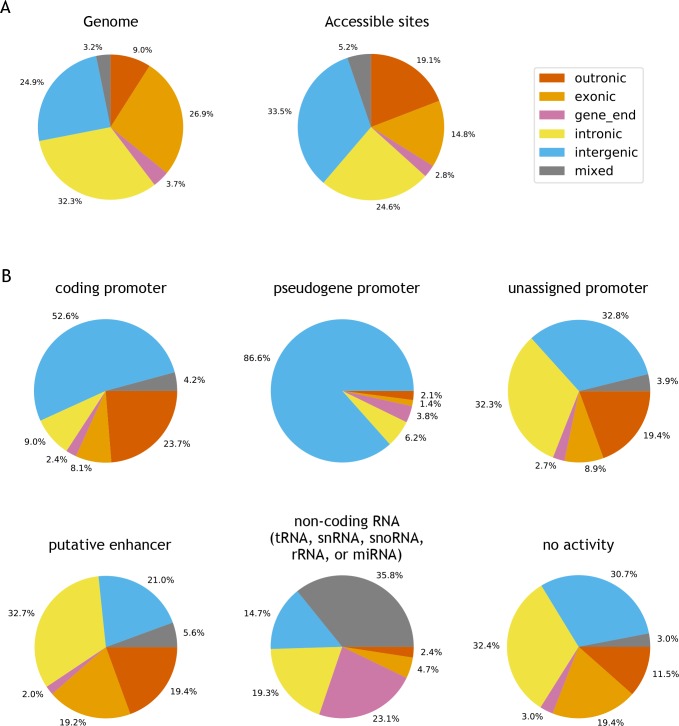
Figure 2—figure supplement 3. Genomic locations of accessible sites.

Figure 2—figure supplement 3.

(A) Left: distribution of bases in the C. elegans genome, partitioned into outronic, exonic, intronic, intergenic or mixed, based on the regulatory annotation. Right: distribution of genomic region type at accessible sites. (B) Distribution of genomic region at specific types of accessible sites.
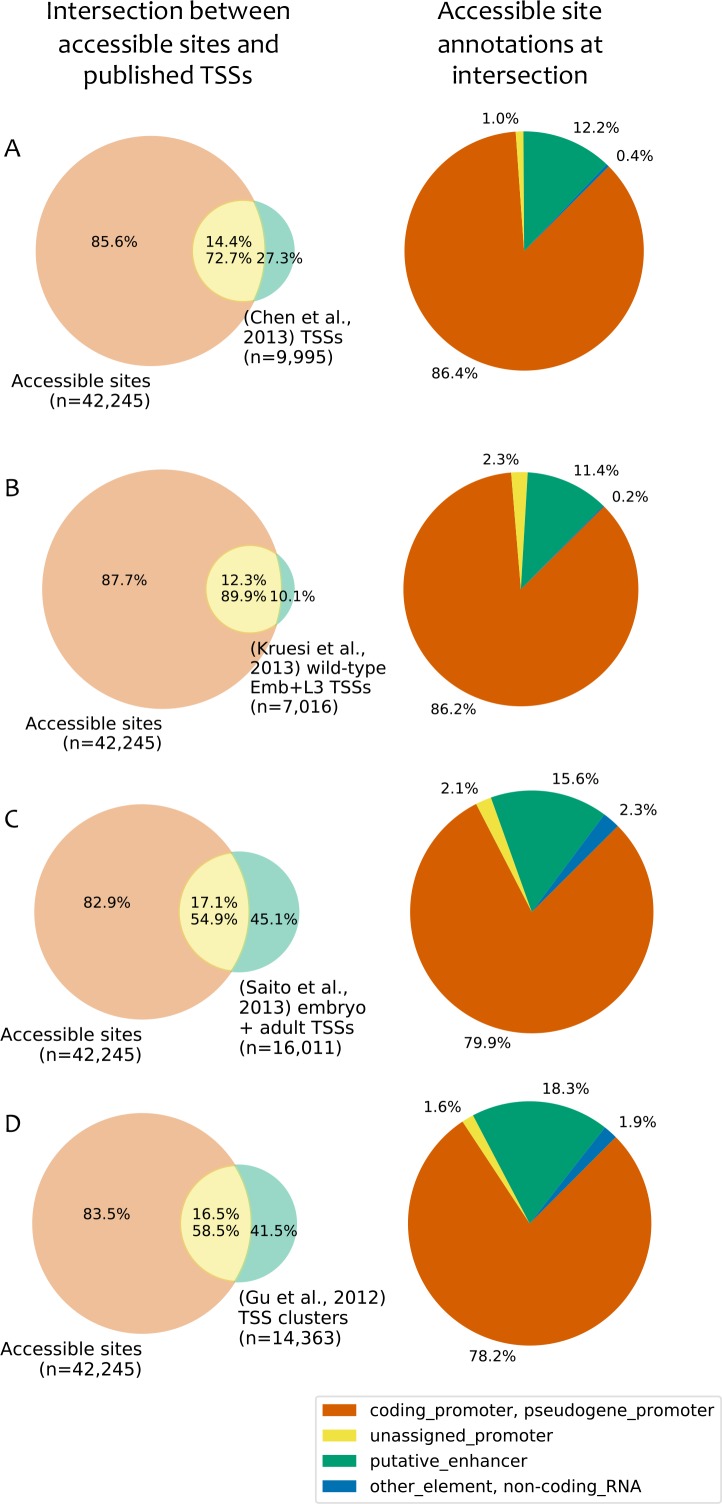
Figure 2—figure supplement 4. Comparison to published TSS maps.

Figure 2—figure supplement 4.

(A–D) Left: overlap between accessible sites and TSS annotations from (A) (Chen et al., 2013); (B) (Kruesi et al., 2013); (C) (Saito et al., 2013); (D) (Gu et al., 2012). Right: accessible site annotations of elements that overlap a TSS in the indicated study. TSSs were considered to overlap an accessible site if they were located within 150 bp of peak accessibility. For Gu et al. (2012), TSSs were clustered using a single-linkage approach using a distance threshold of 50 bp, and the overlaps are based on those clusters.
Figure 2—figure supplement 5. Types of unassigned promoters.

Figure 2—figure supplement 5.

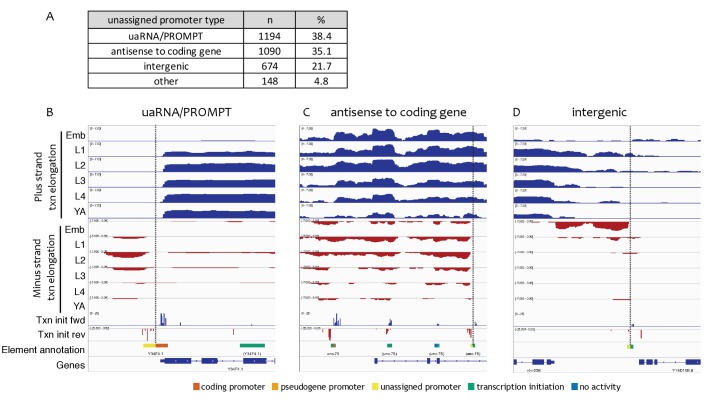
(A) Types and numbers of unassigned promoters. (B–D) Examples of transcription patterns at unassigned promoters. Shown are forward and reverse strand nuclear RNA-seq signals to indicate genomic regions with transcription elongation, forward and reverse strand transcription initiation signal (pooled across stages), and accessible elements colored with left halves indicating reverse strand annotation and right halves indicating forward strand annotation. Vertical dotted lines highlight unassigned promoters. (B) uaRNA/PROMPT (chrIII:1,020,500–1,021,700, 1.2 kb), (C) antisense to coding gene (chrI:11,590,000–11,596,000, 6 kb), (D) intergenic (chrV:2,296,000–2,300,500, 4.5 kb).
Figure 2—figure supplement 6. Transgenic tests of annotated promoters and enhancers for promoter activity.

Figure 2—figure supplement 6.

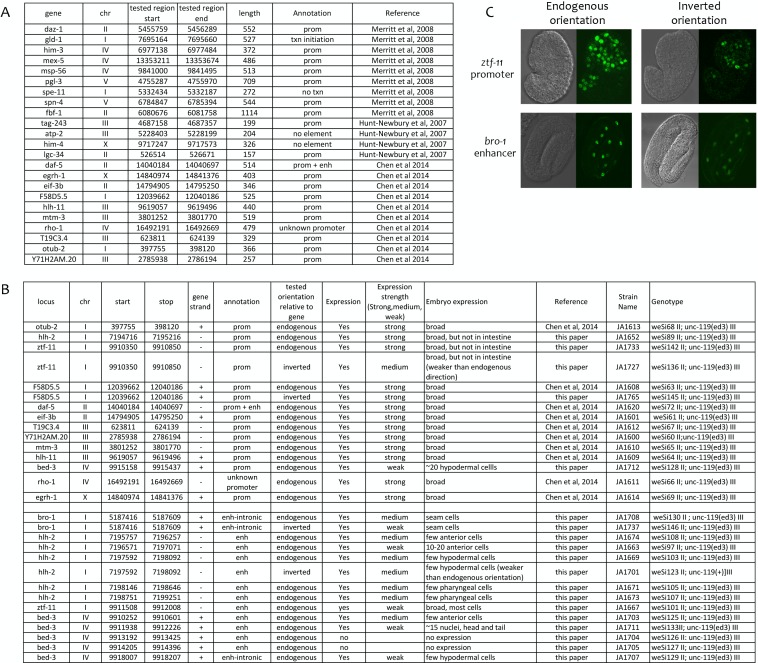
(A) Comparison of annotations to 23 elements previously shown to function as promoters in transgenic assays (Merritt et al., 2008; Hunt-Newbury et al., 2007; Chen et al., 2014). (B) Indicated elements were fused to his-58::gfp (see Materials and methods) and the resulting transgenic strains tested for GFP expression in embryos. Elements were cloned in the endogenous orientation relative to their associated gene or in inverted orientation, as indicated. In expression strength column, ‘strong’ and ‘medium’ indicate high and low level of GFP visible in live embryos; ‘weak’ indicates expression only visible by immunofluorescence. (C) Examples of transgene expression. Shown is expression driven by the ztf-11 promoter and the bro-1 enhancer in both orientations; DIC image on left, HIS-58-GFP on right.