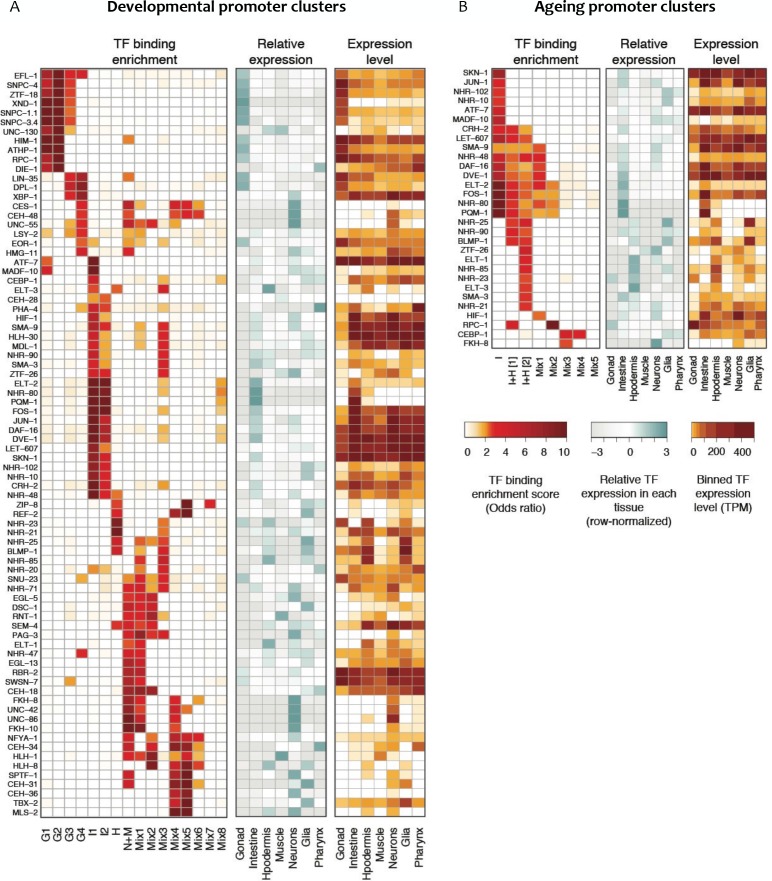
Figure 5. Transcription factor binding enrichment in developmental and ageing promoter clusters.
Transcription factor (TF) binding enrichments in developmental (A) or ageing (B) promoter clusters from Figure 4. TF-binding data are from modENCODE/modERN (Araya et al., 2014; Kudron et al., 2018); peaks in HOT regions were excluded (see Materials and methods). Only TFs enriched more than twofold in at least one cluster are shown, and only enrichments with a p<0.01 (Fisher’s exact test) are shown. Plots show TF binding enrichment odds ratio (left), expression of the TF in each tissue relative to its expression across all tissues (log2(TF tissue TPM/mean of the TF’s TPMs across all tissues), middle), and the decile of expression of the TF in each tissue (right; TPMs < 1 are not taken into account when calculating TPMs deciles). Expression data are from Cao et al. (2017). Legends for Figure Supplements.

