
Figure 5.
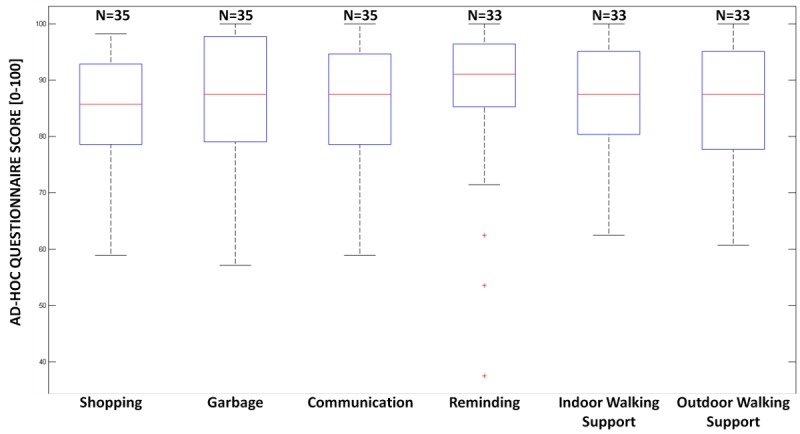
Boxplots of the overall scores, considered as the sum of the item score contributions, rescaled from 0 to 100, for the ad hoc questionnaire. On each box, the central mark indicates the median, the bottom and top edges of the box the 25th and 75th percentiles, and the whiskers the most extreme data points not considered outliers, and the outliers are plotted individually using the “+” symbol.