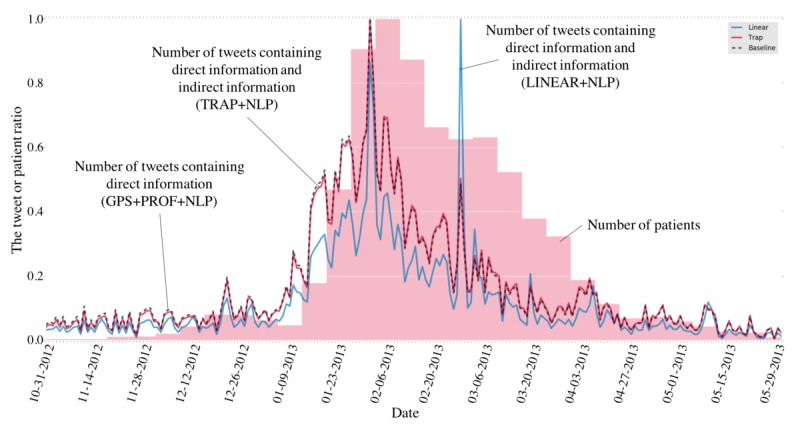
Figure 3.

Amounts of direct and indirect information in a tweet timeline in Hiroshima from November 1, 2012 to May 31, 2013. The black dashed line shows the timeline of direct information (BASELINE+PROF+NLP), the blue line shows the timeline of direct information and indirect information that are aggregated in a naive way (LINEAR+NLP), the red line shows the timeline of direct information and indirect information that are aggregated by the proposed model (TRAP+NLP), and the red area shows gold standard timeline. The x-axis shows the date, and the y-axis indicates the tweet ratio and the patient ratio (normalized by the max value in the season). GPS: global positioning system; PROF: profile information; NLP: natural language processing.
