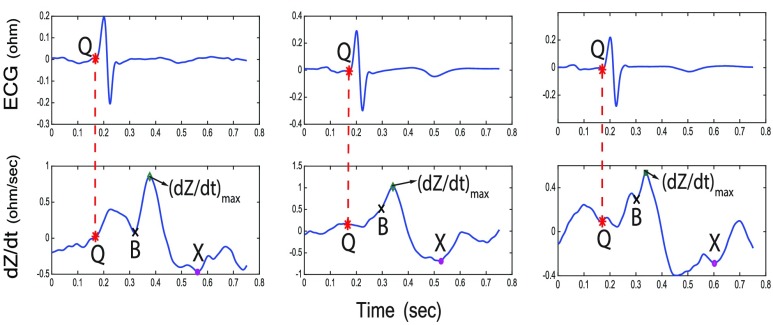
FIGURE 6.
Three cases of dZ/dt (bottom) with the corresponding ECG signal (top) indicating variations in the morphology of dZ/dt signal with the characteristic points identified by the algorithm. Left panel: B and X points occur at a local minimum and global minimum, respectively; Middle panel: the B point is a notch; Right panel: the X point is just a local minimum and NOT a global minimum.

