Figure 12:

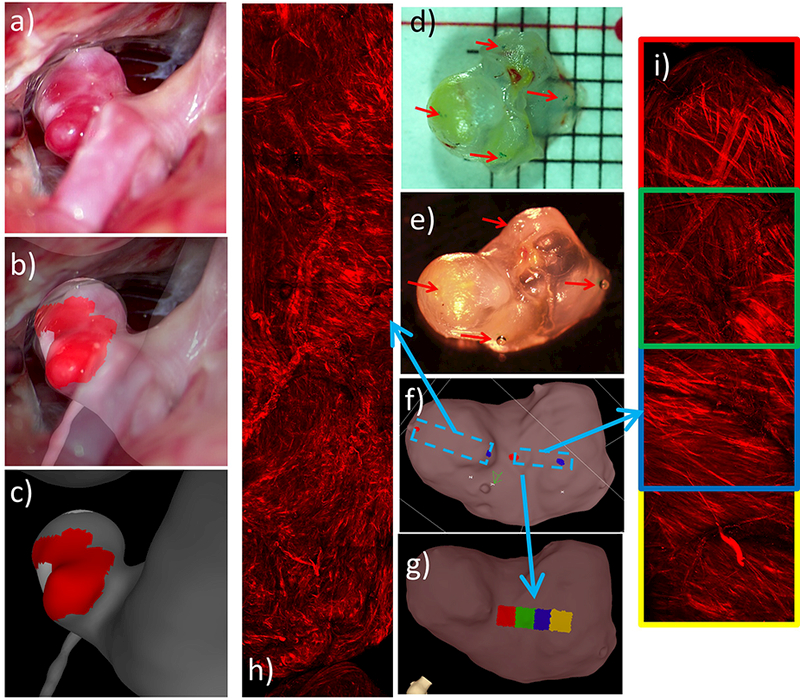
Identifying and marking aneurysm 2 wall regions from operative video, and MPM imaging of tissue sample: a) operative video frame showing exposed aneurysm, b) superposed video frame and 3D vascular model for image-based marking, c) “hyperplastic” (white) and thin (red) regions marked on vascular model using ChePen3D using mapping in (b), d) dissection scope image of resected sample with ink markings applied, e) tissue sample with beads glued on ink markings for micro-CT imaging, f) tissue model marked with MPM imaging regions, g) MPM image labels projected onto tissue model, h-i) mosaics of MPM image stacks.
