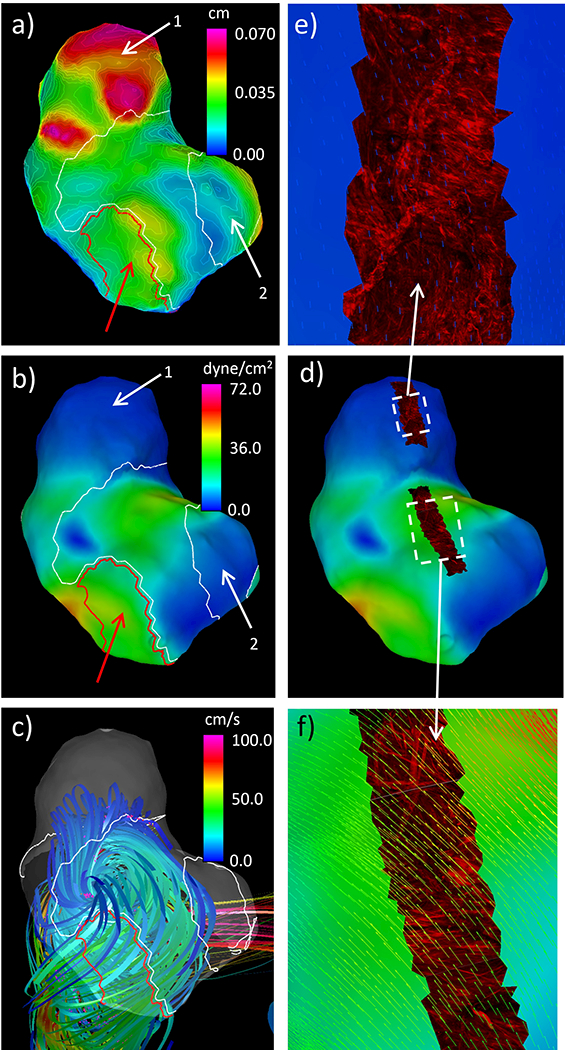
Figure 13:

Simultaneous visualization of hemodynamic and wall characteristics of aneurysm 2: a) wall thickness contours and “hyperplastic” (white) and thin (red) regions (white and red arrows), b) WSS and “hyperplastic” and thin regions (white and red arrows), c) flow pattern and “hyperplastic” and thin regions, d) WSS and textured mapped MPM image stacks, e-f) details of MPM images showing collagen fibers superposed with WSS vectors.
