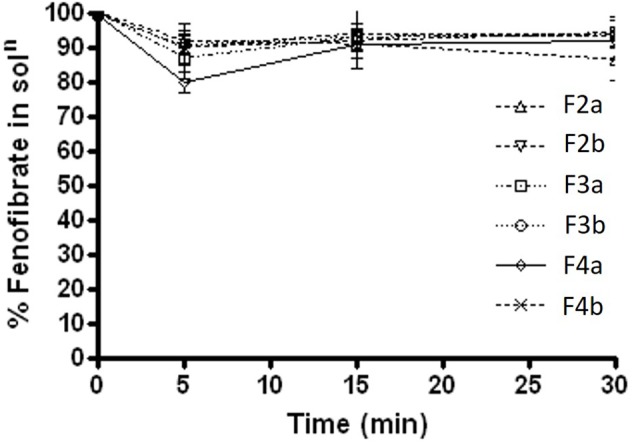
FIGURE 7.

Fenofibrate concentration (mg/mL) in solution during 30 min lipolysis experiments under fed condition. The formulation represent F2a- C70: CM (7:3)/TO106V (1/1), F3a- C70: CM (7:3)/ HCO-30 (1/1), F2b- K70:I742(7:3)/TO106V(1/1), F3b- K70:I742(7:3)/ HCO-30 (1/1), F4a- CMCM/HCO-30 (1/1), and F4b- I742/ HCO-30 (1/1) respectively. Data are presented as mean ± SD, (n = 3).
