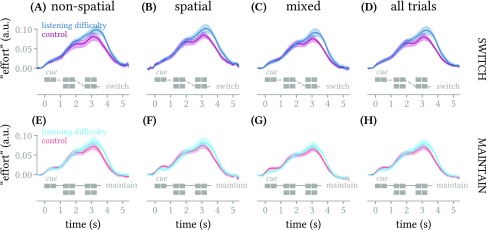
FIG. 4.
(Color online) Mean across subjects (±1 standard error of the mean) of deconvolved pupillary response (effort) for listening difficulty versus control groups, in switch- (top row) and maintain-attention trials (bottom row), in the three experimental conditions and pooled across all conditions (columns). In each subplot there were no temporal spans where the difference between groups was found to be significantly non-zero with a false discovery threshold of 0.05.

