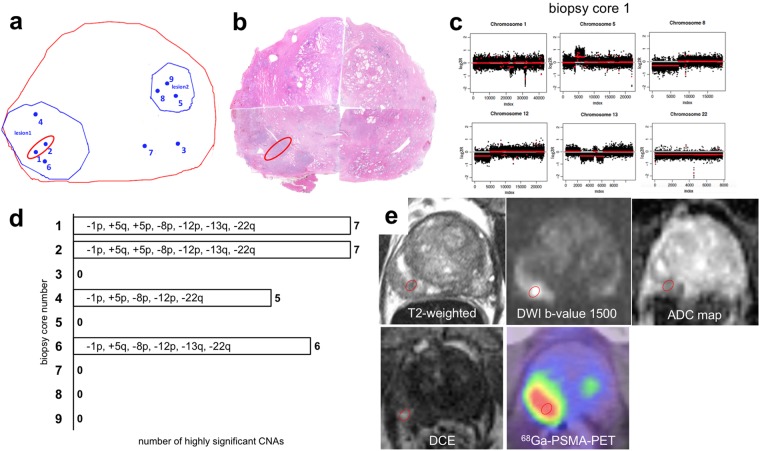
Figure 1.
Correlation between genomic index lesions and imaging parameters in a representative patient. Synopsis of (a) projection map of MRI/TRUS fusion biopsy of patient 2. The prostate margin is shown in red, pre-biopsy mpMRI suspicious lesions in blue and individual biopsy cores that were sent for genomic testing as blue dots. Genomic index lesions are encircled in red; (b) virtual whole mount of the prostatectomy specimen with the red circle matching the genomic index lesion by visual comparison; (c) CNA profiles of the genomic index lesion; (d) overview of CNAs of all biopsies harboring highly significant alterations; (e) mpMRI components (T2w, DWI b-value = 1500 s/mm2, ADC map and early arterial phase of DCE-MRI) and 68Ga-PSMA-11-PET/CT are shown. The visually matched location of the genomic index lesion on individual components is superimposed on the axial slices centered on the mpMRI lesion used during MRI/TRUS biopsy.

