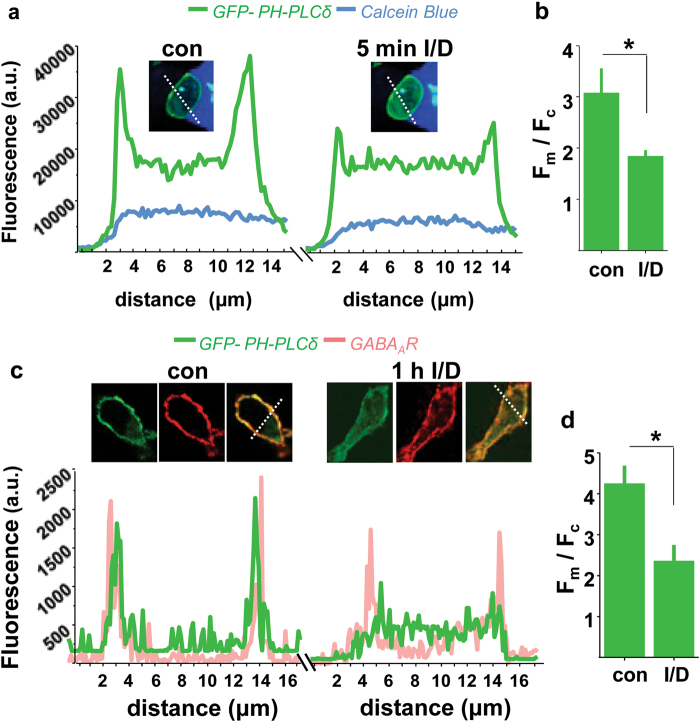
Fig. 5.
Diazepam/Isoguvacine-dependent translocation of GFP-PHPLCδ1 from the cell membrane to the cytoplasm in α1/β2/γ2-HEK293 cells. a Live imaging of a Calcein blue-labelled cell (inset) showing changes in GFP-PHPLCδ1 fluorescence intensity profile (green) prior to (left) and 5 min after the addition of Diazepam (D; 1 μM)/Isoguvacine (I; 5 μM) (right). b Quantification of fluorescence F(membrane)/F(cytoplasm) ratio of GFP-PHPLCδ1 (green; mean ± s.e.m.; Student t-test; *p < 0.05; n = 10 cells from 2 independent experiments). c Imaging of surface GABAAR-β2-subunit in fixed HEK293 cells (red) expressing GFP-PHPLCδ1 (green) in control (DMSO, left) and Diazepam (D; 1 μM)/Isoguvacine (I; 5 μM) treated samples for 1 h (right), showing superimposed fluorescence intensity profiles across the selected cells. d Quantification of fluorescence F(membrane)/F(cytoplasm) ratio of GFP-PHPLCδ1 (green; mean ± s.e.m.; Student t-test; *p < 0.05; n = 10 cells from 2 independent experiments)

