Fig. 1.
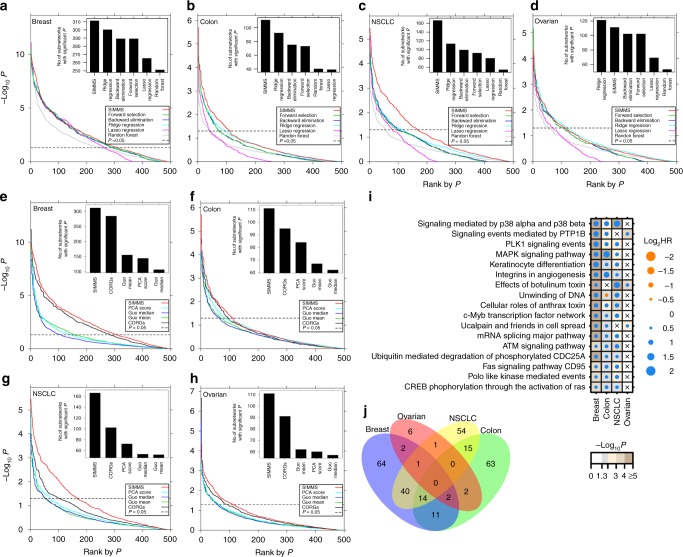
Benchmarking prognostic subnetworks. a Comparison of prognostic ability of subnetworks in validation sets of breast cancer using SIMMS and five machine learning algorithms. For each algorithm, Wald P values were ranked in increasing order. The number of validated subnetworks identified by each algorithm (P < 0.05, above horizontal dashed line) are shown as barplots. b–d Same visualization as (a) using data for colon, NSCLC and ovarian cancers. e Comparison of SIMMS against other pathway/subnetwork scoring methods. For each method, ranked P values and total number of significant subnetworks are shown following prognostic assessment in breast cancer validation sets. f–h Same as (e) using data for colon, NSCLC and ovarian cancers. i Dot plot of univariate hazard ratios and P values (Wald-test) for each of the top n subnetworks significantly associated with patient outcome (|log2 HR| > 0.584, P < 0.05) in at least 3/4 cancer types. A Cox proportional hazards model was fitted to dichotomized risk scores across the entire validation cohort. Crosses represent absence of a module from a particular cancer type. j Overlap of candidate subnetwork markers across breast, colon, NSCLC and ovarian cancers

