Fig. 2.
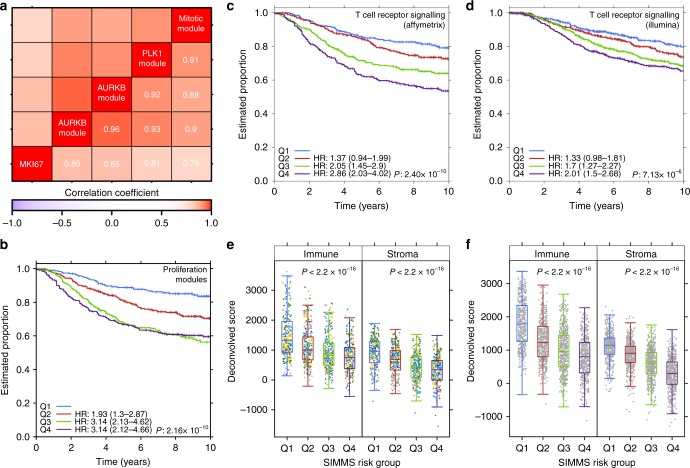
Proliferation and immuno subnetworks. a Heatmap of correlation (Spearman) and cluster analysis of patient’s risk scores of proliferation modules in breast cancer, alongside mRNA abundance of a proliferation marker MKI67. Ward’s method was used for hierarchical clustering. Data shown for validation cohorts. b Kaplan–Meier analysis of predicted proliferation scores (validation cohorts) using SIMMS-derived proliferation biomarker. Groups (Q1-Q4) were established using quartiles derived from the training set. Groups Q2-Q4 were compared to Q1 using Cox proportional hazards model. P value was estimated using Log-rank test assessing heterogeneity across the four groups. c Kaplan–Meier analysis of tumor immune microenvironment driver subnetwork (BioCarta pathway: T cell receptor signaling) in Affymetrix based validation cohorts. Quartile based risk groups (thresholds derived from training set), demonstrating linear increase in the likelihood of recurrence/event. Test statistics same as in b. d Kaplan–Meier analysis of tumor immune microenvironment driver subnetwork (BioCarta pathway: T cell receptor signaling) in Metabric breast cancer cohort (Illumina platform). e Assessment of computationally inferred immune system infiltration and stromal estimates against SIMMS predicted risk groups (Q1-Q4 i.e., low to high) in Affymetrix validation cohorts (test statistic: ANOVA P value). Color of dots represent respective validation cohort (Supplementary Table 2). f Same as e using Metabric cohort (Illumina platform)

